


What is thermal imaging and how does it work?
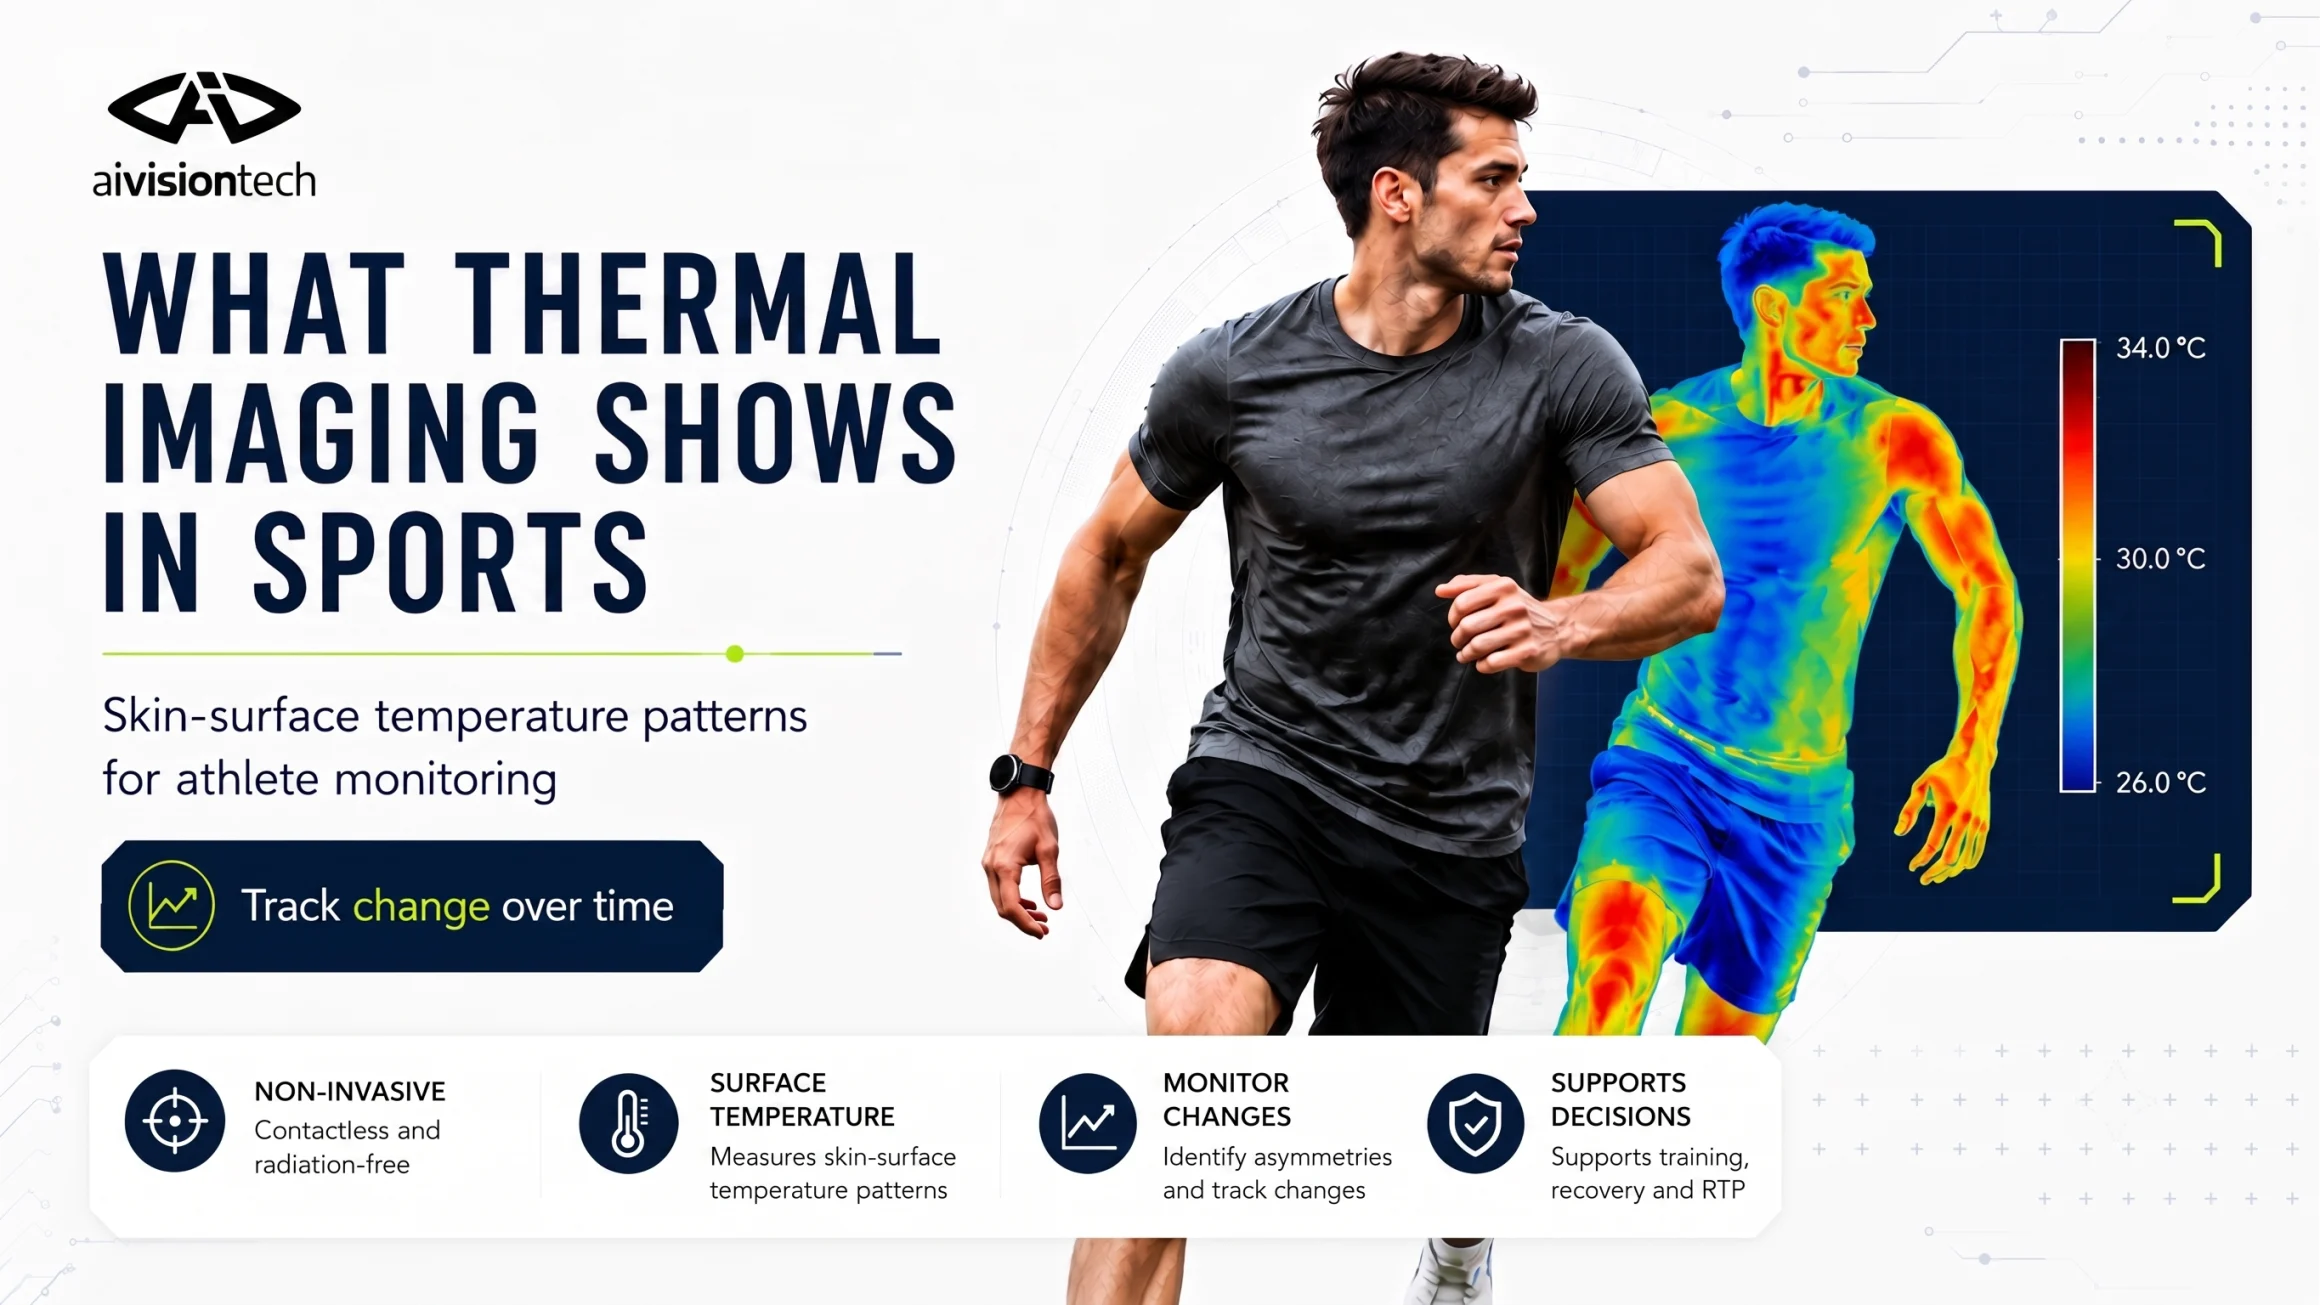
Every surface with a temperature above absolute zero emits infrared radiation that the human eye cannot perceive. Thermal imaging is based on measuring this radiation to determine surface temperature. The devices that perform this measurement are called thermal cameras. Sensors in thermal cameras generally detect infrared radiation in the 8-14 um range (Long-Wave Infrared, LWIR). Software then converts the data from the sensor into temperature values, producing thermal images of the temperature distribution across the surface.
The temperature matrix generated by a thermal camera is mapped to a color palette across the minimum and maximum temperatures, or a temperature range set by the user, to create thermal images that users can understand. Color palettes are a feature provided by cameras and selectable by the user. In the globally used rainbow color palette, hot areas are shown in shades of yellow, red, and white, respectively, while lower-temperature areas are shown in shades of green, blue, and purple. It should be remembered, however, that these colors are not the measurement itself; they are visual representations of numerical temperature values according to the selected palette. The same measurement can look quite different when opened with a different color palette. Therefore, it is impossible to make an objective interpretation simply by observing a thermal image. Specialized software and artificial intelligence models should be used for regional temperature values in thermal images, differences between the right and left sides, and changes compared with previous measurements (see ai4sports, ai4body, ai4animal, ai2neo).
For the camera to calculate temperature accurately, technical variables such as the skin's emissivity, imaging distance, ambient temperature, and temperature reflected from the surroundings must be set appropriately. Although human skin is a suitable surface for infrared measurement, sweat, body lotions, humidity, sunlight, and marks left on the skin by clothing tight enough to affect blood flow can affect the measurement. For a valid comparison, pre-imaging preparation is as important as camera quality.
What does a thermal camera measure on the body?
A thermal camera measures skin-surface temperature, but it neither directly determines the internal temperature of a muscle, tendon, ligament, or joint nor shows anatomical structure. While MRI enables imaging of structural changes in muscle and connective tissue, ultrasound can enable the examination of specific tissues during movement. Because thermography records temperature distribution on the body surface, each of these methods answers a different question and cannot replace another.
Important Note: While most medical imaging systems use anatomical imaging, thermography focuses on imaging physiology and function.
Key distinction: A thermal image shows surface temperature. On its own, it cannot determine the type, extent, or exact location of internal tissue damage.
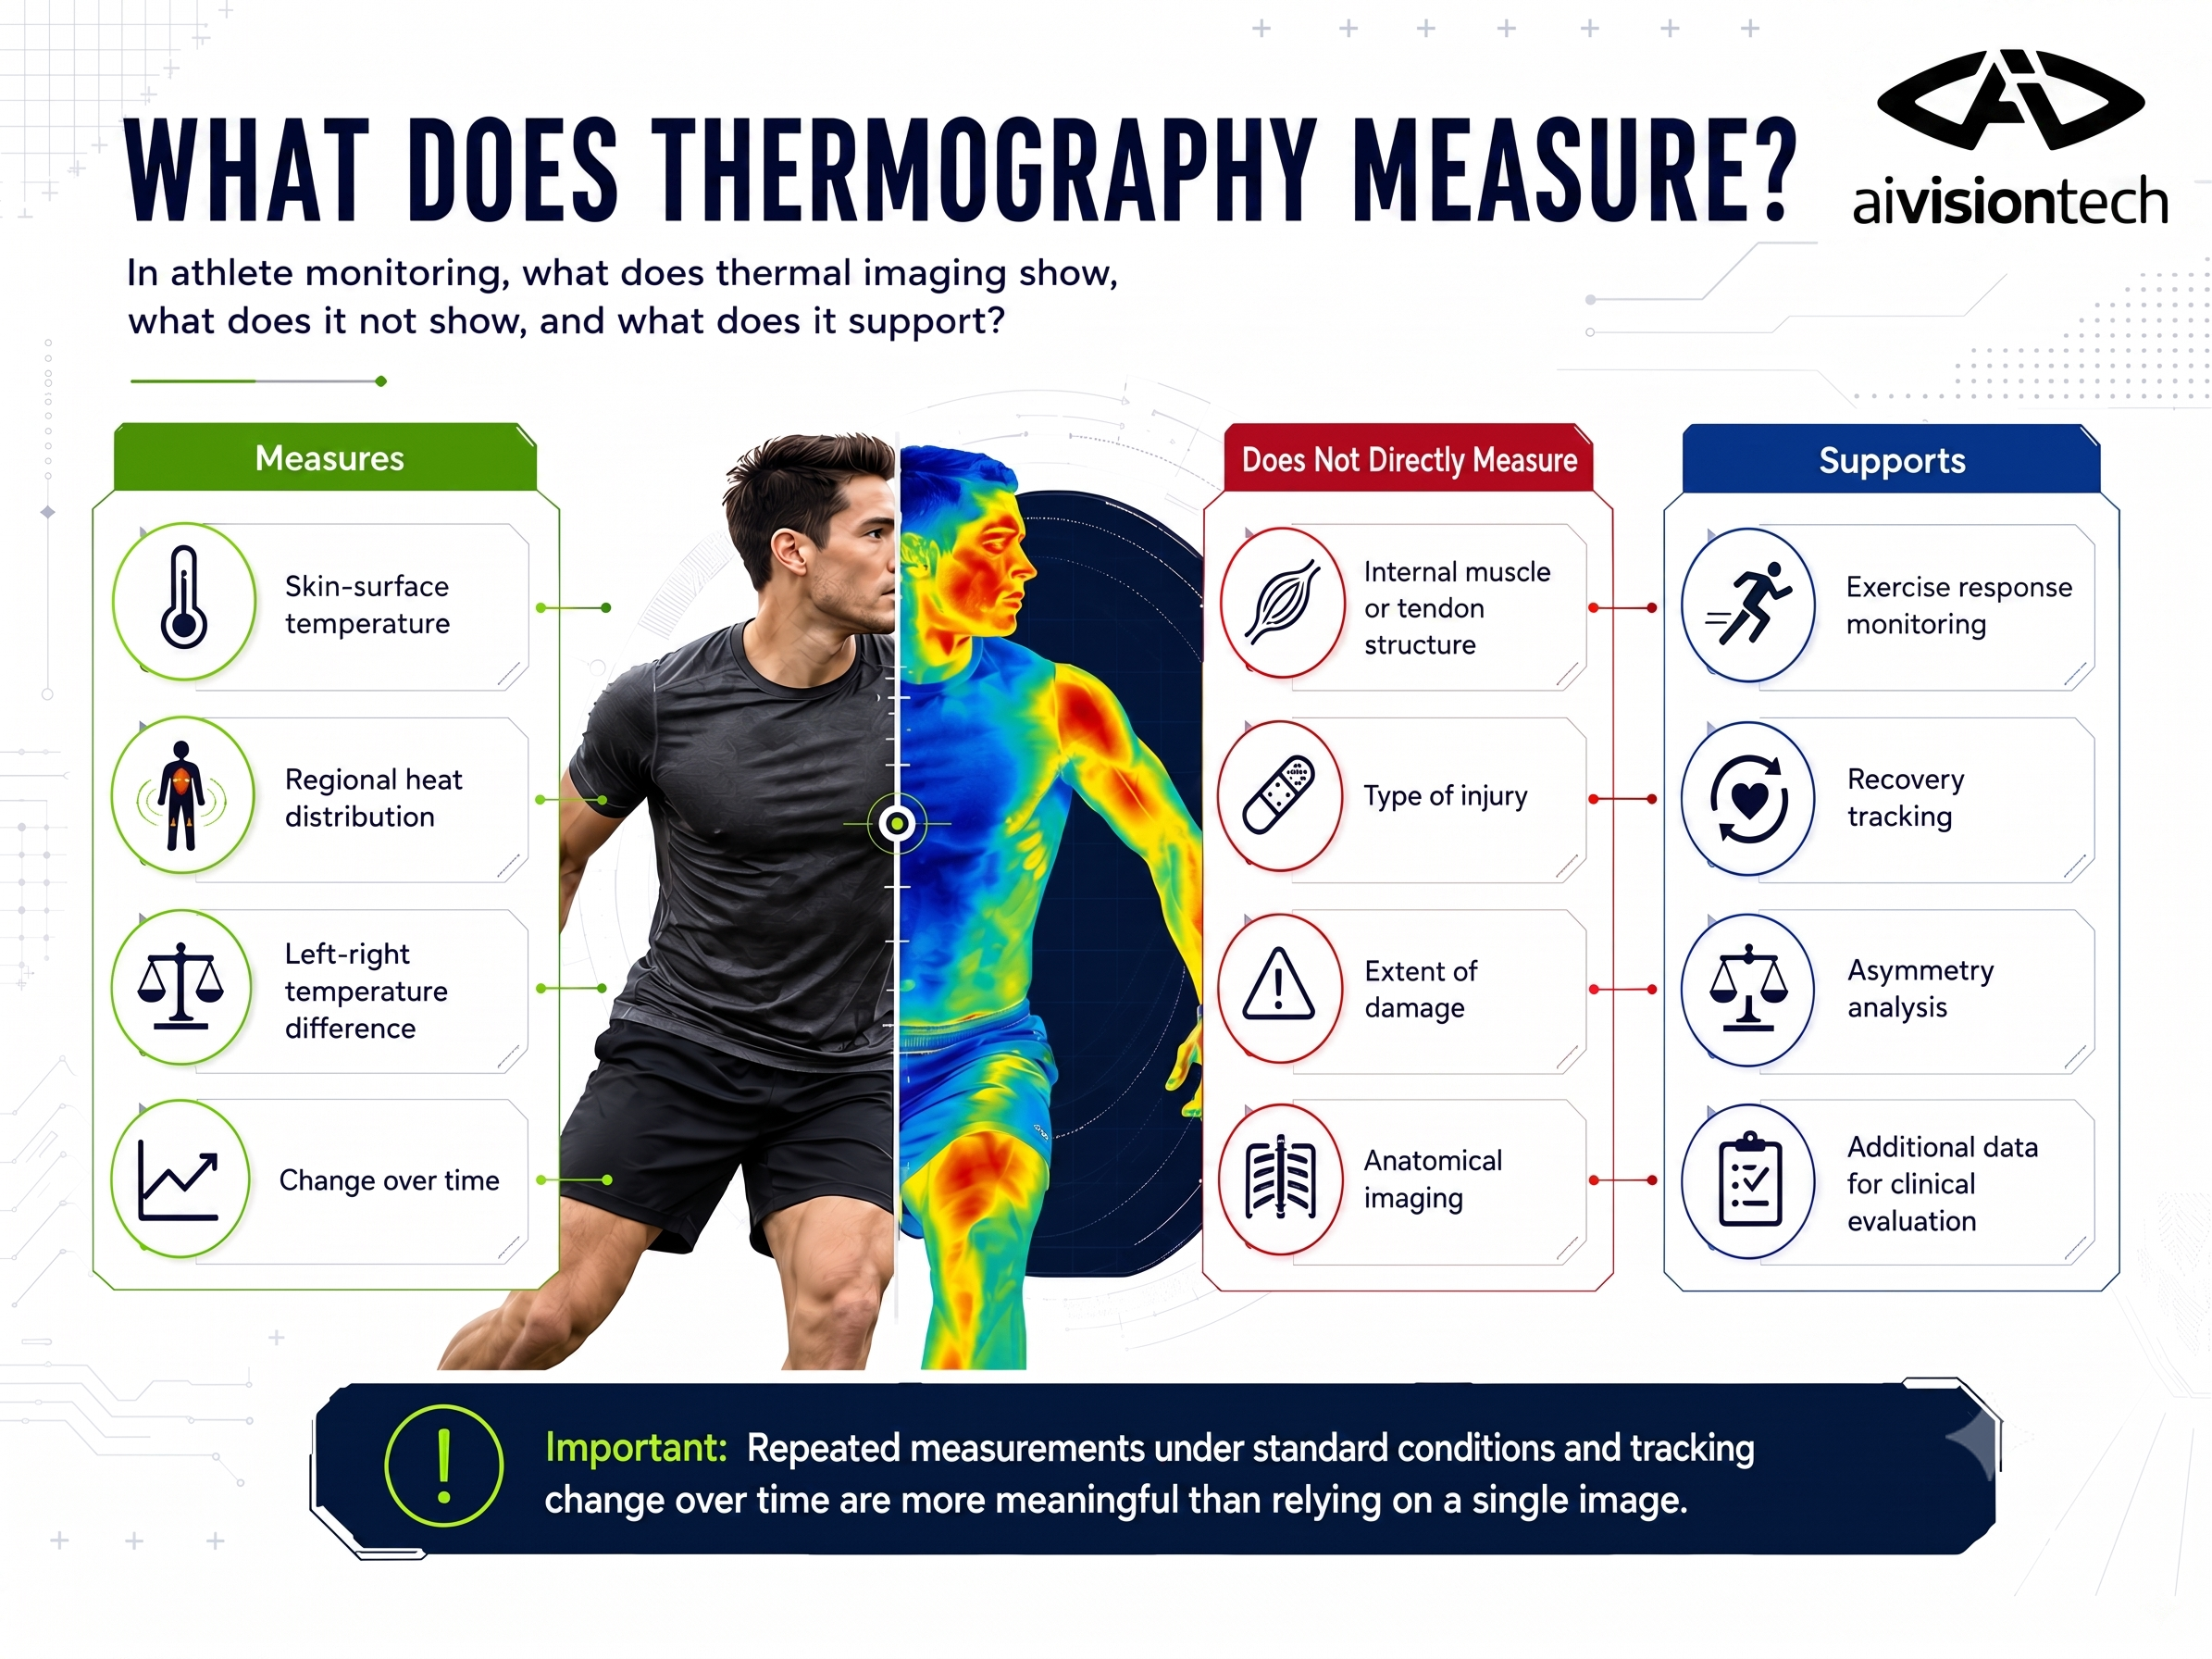
Skin temperature is affected by blood flow, sweating, and the body's thermoregulation mechanisms. During exercise, the energy demand of working muscles increases while the body simultaneously attempts to transfer the heat produced to the environment. Changes in skin temperature are the surface-level result of these processes. In damaged or overused areas, core heat rises, forming localized high-heat areas toward the surface. At the same time, temperature decreases in areas where circulation and blood supply are reduced for metabolic or various reasons. These patterned areas can be observed and interpreted through thermal imaging. In contrast, it is not correct to associate every area that appears warm due to external effects after an impact, hot/cold compression, or intensive training with inflammation, or every area that appears cooler with circulatory impairment or injury.
For these reasons, thermal imaging is used in sports not as a diagnostic tool, but rather as a method for injury and fatigue risk monitoring and continuous tracking. Whether a specific area has changed compared with the athlete's previous measurement, whether both sides respond similarly after the same exercise, or how the distribution on a rest day changes after training can be assessed through surface temperature data. At the same time, temperature-distribution trends for each muscle/joint region over a given period and disruptions in these trends should also be considered in risk assessments.
Why is thermal imaging used in sports?
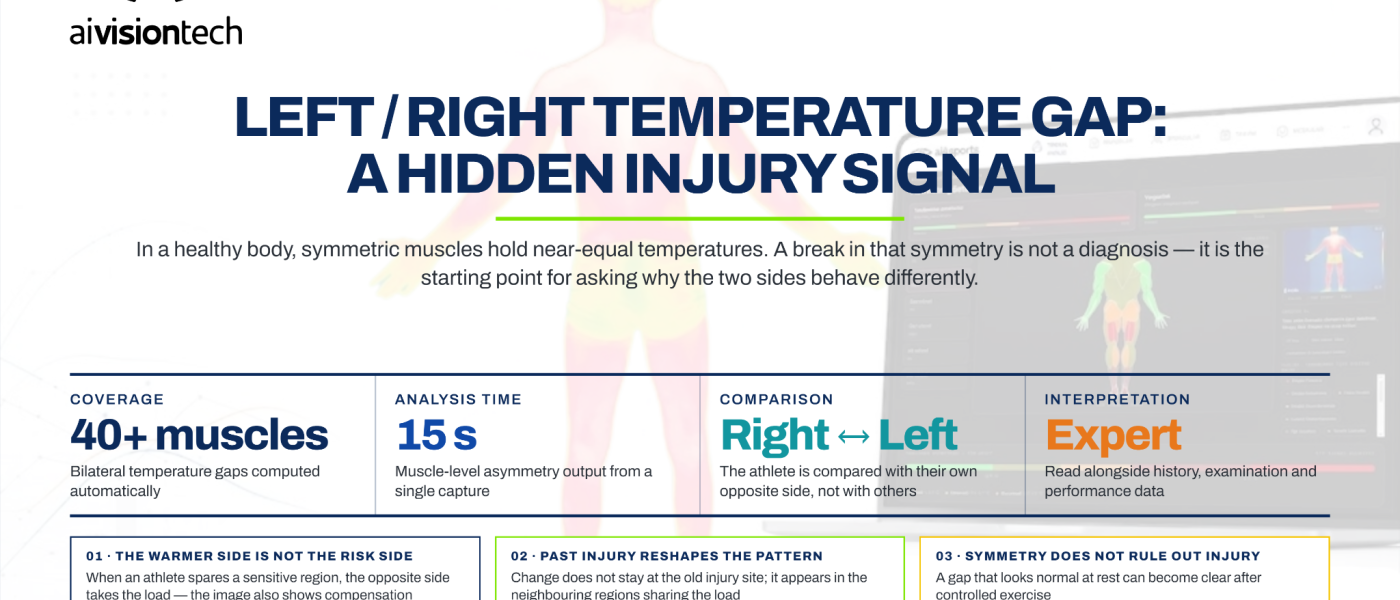
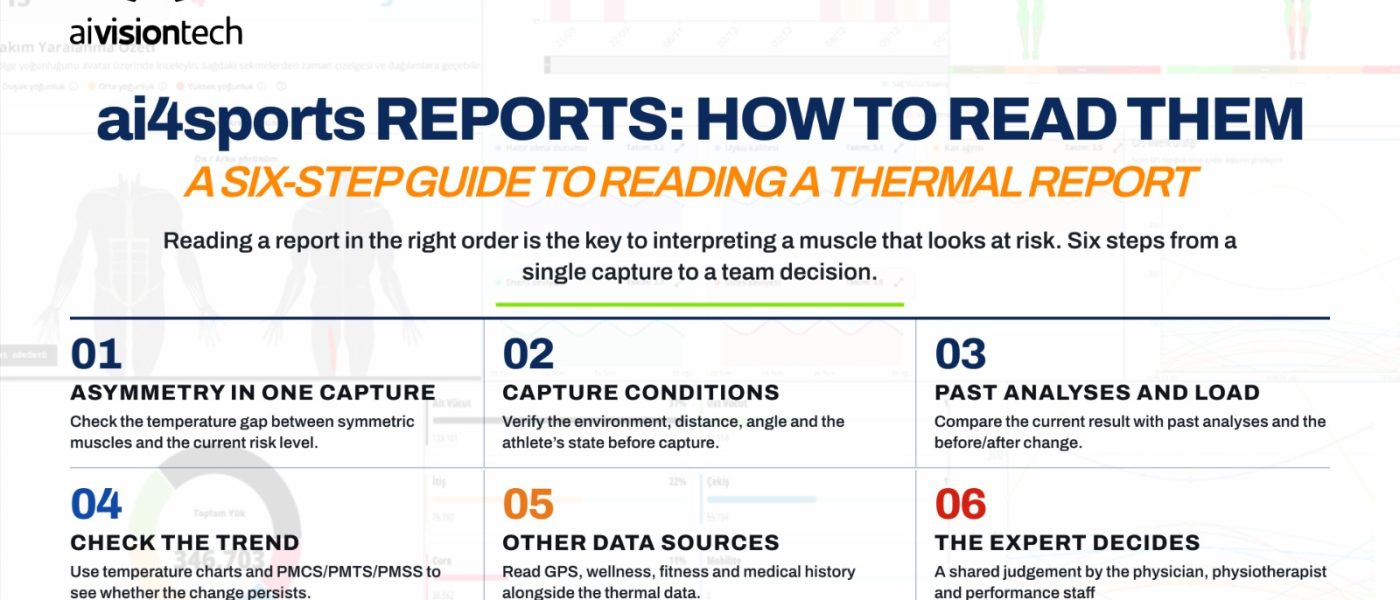
Because a single data source is often insufficient in athlete monitoring, different specialists assess findings related to their own fields together. While the coach monitors external load with data such as GPS and Polar watches, and internal load with data such as perceived exertion and heart rate, the physiotherapist examines movement quality, strength, and the athlete's reported complaints. The sports physician also relies on clinical examination and, when necessary, structural imaging methods. Thermography adds data on the temperature distribution on the body's surface to this assessment. With ai4sports, the reaction of muscles to the physiological load resulting from training is objectively analyzed and reported simultaneously within 15 seconds. In this way, ai4sports serves as a bridge within a sports club as a shared tool that facilitates information sharing between health and athletic performance teams.
Monitoring the regional response to exercise
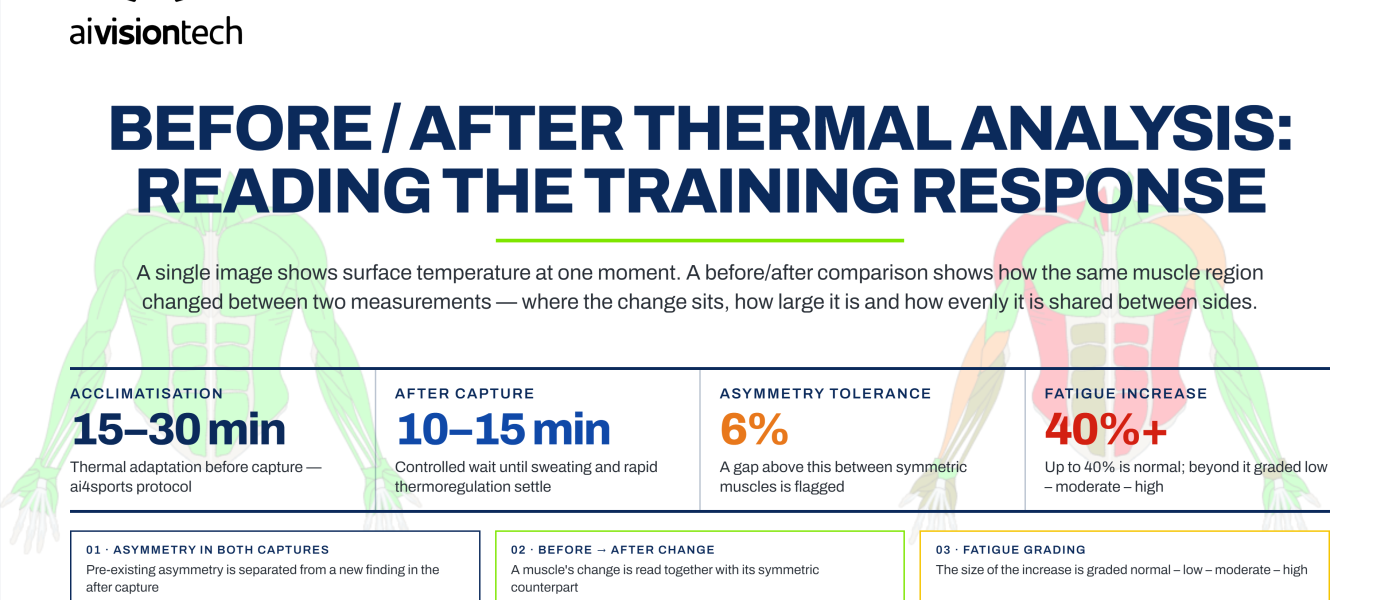
Skin temperature is not expected to change in the same direction in every region after exercise. The type of exercise, which regions it activates more, its intensity, its duration, and when the image is taken affect the result. A systematic review published in 2024 showed that thermal responses in sports and exercise studies differ depending on these variables [1]. While temperature may increase in some regions, a decrease may be observed in others. For this reason, interpretations based on a single image are limited when assessing the overall picture, whereas regular monitoring and trend analysis in thermal imaging improve accuracy.
When thermal data are recorded regularly, an athlete's responses to similar loads can be compared. For example, if the temperature distribution seen in a football player's thigh after intensive training differs distinctly from measurements in previous weeks, the team can examine this change together with training load, the athlete's pain report, and performance results. In this respect, thermal imaging generates highly critical insights for health and athletic performance teams.
Tracking changes between the right and left sides
The human body is not entirely symmetrical. The dominant side, movement characteristics of the sport, past injuries, and daily habits can create natural differences between the two sides. Therefore, not every temperature difference is considered a sign of risk. Using a single universal threshold without knowing the athlete's own historical measurements would be misleading.
A study of 27 U-19 football players with a history of ankle injury reported that thermal asymmetries in the ankle and some lower-extremity regions changed alongside training load [2]. As this study demonstrates, information such as an athlete's injury history, previous analyses, and dominant side are important factors in evaluating the result of a thermal assessment.
Examining changes not seen at rest after exertion
Some risks and temperature differences may not be observed in an image taken from an athlete at rest. In a 2024 case report focused on the sartorius muscle, an asymmetry that was not noticeable in the baseline image became apparent after 10 minutes of controlled cycling exercise, and the athlete was subsequently assessed with MRI [3]. As this case also shows, in assessments where the user suspects an issue, short-duration exercises that provoke the muscles can reveal underlying problems, and thermography is the fastest and most objective tool for evaluating this.
This approach does not mean making the athlete exercise in an uncontrolled manner. The exercise to be performed should be safe, controlled, and appropriate to the athlete's current condition. For an athlete with pain or a known injury, the healthcare team decides on loading.
Recording the recovery process
Images taken on different days during the recovery period can show the course of regional temperature distribution over time. In a preliminary study involving three professional football players with documented injuries, athletes were imaged again during rest and treatment periods [4]. The study shows that sequential images taken under the same protocol can be used to record changes in the healing process.
However, a return-to-sport decision should not be made by looking only at the thermal image. While pain, strength, joint range of motion, sport-specific performance tests, and response to controlled loading are assessed together, thermal measurements can provide additional data and guidance for this process. Just as a return of the image toward the usual distribution is not sufficient on its own for return to sport, persistence of a temperature difference does not require training to be stopped directly. Here, personalized training methods and the creation of exercises that protect or strengthen the relevant region are matters that the technical and health teams should decide together.
Why should change be monitored instead of relying on a single measurement?
A thermal image records only the moment at which it is taken. An athlete having just entered the measurement room from a cold environment, having sat down recently, wearing tight clothing, or moving immediately before measurement can change the image. It is difficult to draw a strong conclusion about the athlete's usual condition from such a single frame. Therefore, thermal images should be taken in a stable environment according to established standards.
In regular monitoring, the same body regions are measured repeatedly under similar conditions, and the new image is compared with the athlete's personal historical values. Measurements before and after loading can be recorded separately to understand whether the change persists in the next imaging session. This arrangement allows transient environmental effects and recurring noise to be better separated from thermal data.
For the most meaningful comparison with historical data, the athlete's own previous measurements should be used. It is normal for two athletes receiving the same training load to give different thermal responses, and this difference is natural. Here, thermal analysis results play a critical role in measuring athletes' reactions to training, assessing which athlete is at greater risk, and prioritizing treatment.
How does the thermal analysis process work?
The TISEM consensus statement, developed to standardize skin-temperature measurement in sports and exercise medicine, defines the variables that need to be controlled from before imaging through image analysis [5]. The protocol used may vary according to the purpose of the application. Nevertheless, the following steps need to be clearly defined in a reliable measurement process.
- When the athlete last exercised, whether they showered, whether they were exposed to sunlight, products applied to their skin, and other conditions that may affect the measurement are recorded.
- The temperature and humidity of the imaging room are controlled. The athlete acclimatizes to the environment for the period specified in the protocol.
- Camera distance, imaging angle, the athlete's posture, the regions to be imaged, and the temperature scale are kept the same in every measurement.
- It is clearly stated whether the image was taken at rest, after warm-up, after training, or on a recovery day.
- Right and left regions are compared within the same anatomical boundaries. Numerical values are examined before interpretation is made according to the color palette.
- Results are interpreted together with the athlete's historical records, load data, complaints, and expert assessment.
When one of the measurement conditions changes, the difference between images may not originate from the athlete. Therefore, the first question before analysis is whether the two imaging sessions are comparable. A high-resolution thermal image taken under non-standard conditions does not provide a reliable comparison.
Its role in sports medicine and sports science
Thermography neither replaces the assessment of a sports physician, physiotherapist, or coach nor provides an alternative to structural imaging methods. The skin-surface temperature data provided by the method become meaningful only when considered together with the athlete's complaints, examination findings, training history, and functional test results.
For example, when a previously unseen temperature difference is identified between the two sides in the calf region, the imaging conditions are first checked and, if necessary, the measurement is repeated at an appropriate time. The athlete's pain, tenderness, movement quality, and recent training-load data are then assessed. If the healthcare team considers it necessary, it may use methods such as MRI or ultrasound. Therefore, a temperature difference may require a more detailed assessment, but does not determine the decision to be made on its own.
Thermal analysis is also positioned as a tool that enables healthcare teams, which need to assess dozens of athletes within a limited time, to focus by identifying the most critical athletes.
Short checklist for correct use
- Were ambient temperature and humidity recorded for every imaging session?
- Did the athlete wait for the period specified in the protocol to acclimatize to the measurement environment?
- Are camera distance, imaging angle, the athlete's posture, and the temperature scale consistent with the previous imaging session?
- Were measurement time and the most recent physical activity clearly recorded?
- Was the result compared with the athlete's personal baseline values and previous measurements?
- Were thermal findings considered together with load, pain, function, and expert assessment?
How does ai4sports structure thermal analysis?
For regular athlete monitoring, the relevant muscle areas in thermal images need to be segmented correctly, temperature data obtained from the images need to be stored in a consistent format, comparable regions need to be selected, and results need to be converted into a report that the team can read. ai4sports is an advanced artificial intelligence tool that enables imaging, regional analysis, comparison of the two sides, and structured reporting to be carried out in a coordinated manner.
This structure reduces the possibility of a thermal image being interpreted out of context and gives the team an objective tool through which it can regularly monitor regional temperature values, asymmetries, and changes across repeated measurements. The resulting report is used together with other findings to support the assessment of the coach, physiotherapist, and sports physician.
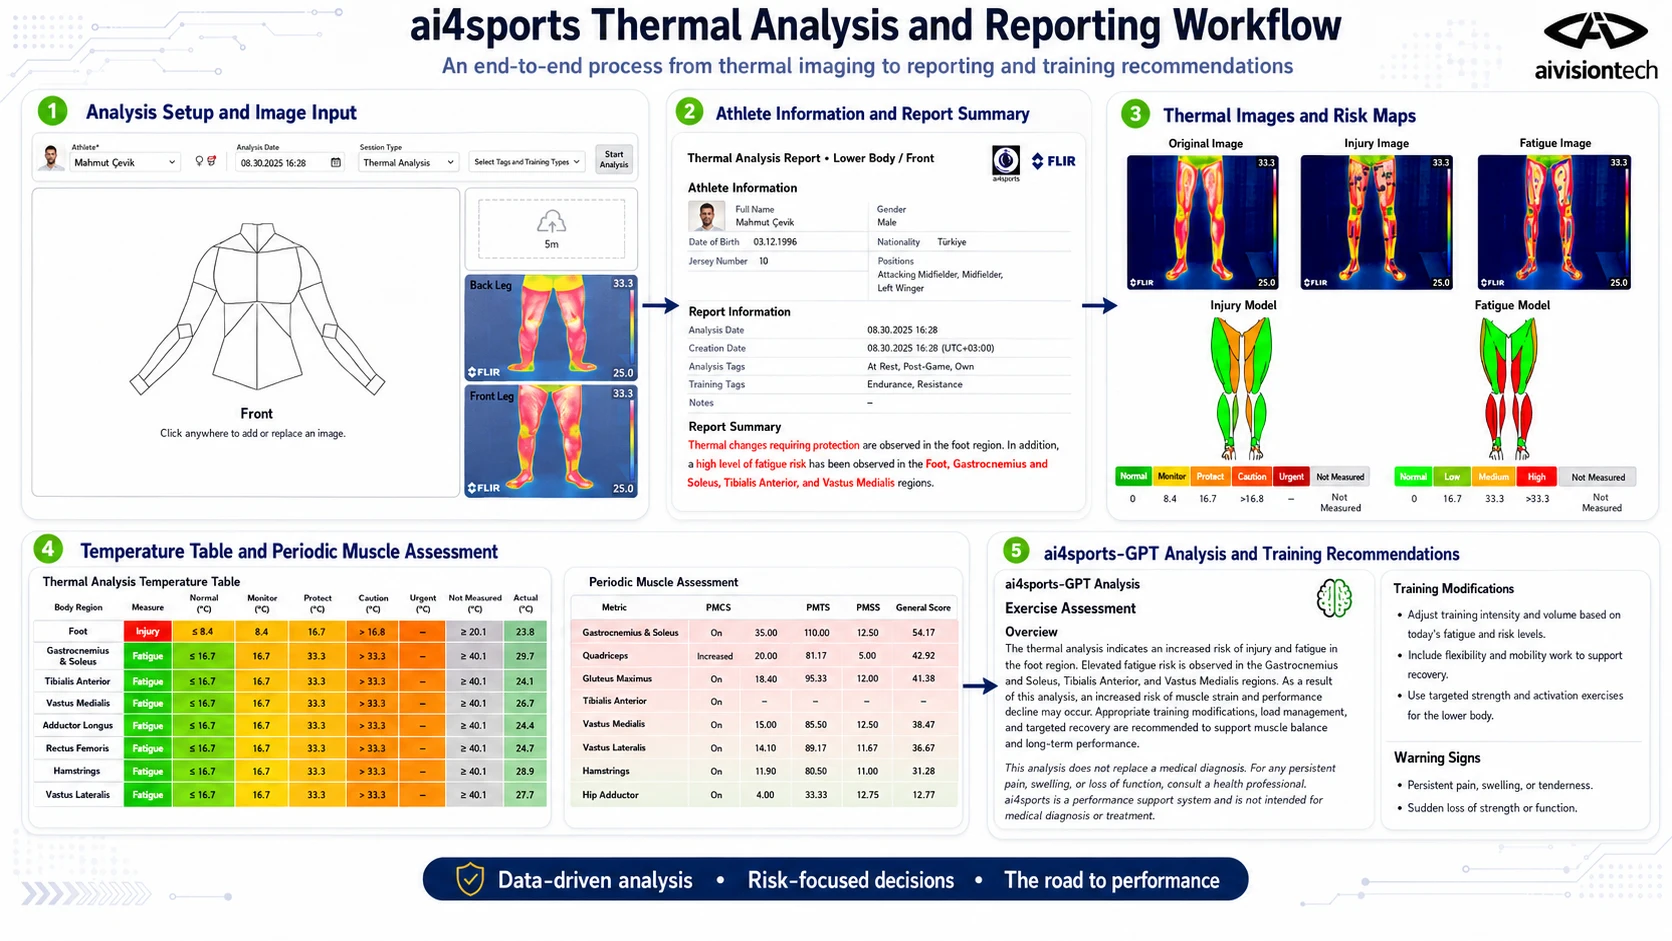
To experience the on-field imaging and reporting process, explore the ai4sports demo workflow.
What should be expected from a thermal image?
Thermal imaging records the temperature distribution on the skin surface quickly and without contact. In athlete monitoring, it can contribute to tracking asymmetries, regional responses to exercise, and changes during the recovery period. However, these data become meaningful when measurement conditions are standardized and images are compared over time.
When these limits are considered, it becomes clear that an area appearing warm does not directly mean injury, and a thermal image appearing normal does not prove that all tissues are healthy. Thermography should be used as one of the measurement methods that supports expert assessment and should not be considered a diagnostic tool on its own. A sound assessment focuses not on a single color, but on change that emerges relative to the athlete's previous measurements.
References
1. Masur L. et al. (2024). Response of infrared thermography related parameters to (non-)sport specific exercise: a systematic review. 2. Bayrak A., Çevik M., Ceylan M. (2025). Thermal Asymmetry in Football Players Following Ankle Injury: Findings Related to Training Load. 3. Bayrak A., Ergene M.C., Ceylan M. (2024). Thermography method under the influence of exercise in the detection of muscle injuries: Sartorius muscle case report. 4. Ergene M.C., Bayrak A., Ceylan M. (2020). Tracking the injury recovery of professional football players using infrared thermography. 5. Moreira D.G. et al. (2017). Thermographic imaging in sports and exercise medicine: A Delphi study and consensus statement on the measurement of human skin temperature.