


What Is Before/After Thermal Comparison?
Before/After analysis compares the temperature behavior of the same muscle region at two different time points. If the first measurement is T1 and the second is T2, the analysis numerically evaluates how much the same muscle changes from T1 to T2.
The most common use is pre-training and post-training imaging. However, recovery, rehabilitation, or different loading periods between two dates can be compared using the same approach.
Thermal imaging is a non-invasive, contactless imaging method. It does not expose the body to ionizing radiation, making it suitable for repeated use scenarios such as pre/post-training or routine daily imaging.
When Should Images Be Captured for Comparison?
Capture timing should be selected according to the parameter that is being measured and evaluated. A pre-training measurement shows the athlete's thermal state before loading. A post-training measurement is used to compare how muscle regions respond to the applied load. A next-day or post-recovery measurement can help determine how much of the change has resolved or persisted.
A post-training measurement may refer to images obtained at +1, +12, +24, or +48 hours after exercise. Studies in the literature show that comparing images acquired at different post-exercise intervals with pre-exercise measurements can reveal temperature-map changes in different directions [1],[2],[3].
Why Are Standardized Capture Conditions Critical?
To attribute a difference between two images to a physiological factor, Before/After measurements must be acquired under standardized conditions. If room temperature, humidity, camera distance, or athlete positioning changes between sessions, true physiological change may be confounded by environmental effects. We discuss capture standardization in detail in our article What Is Thermal Imaging and How Is It Used in Sports?.
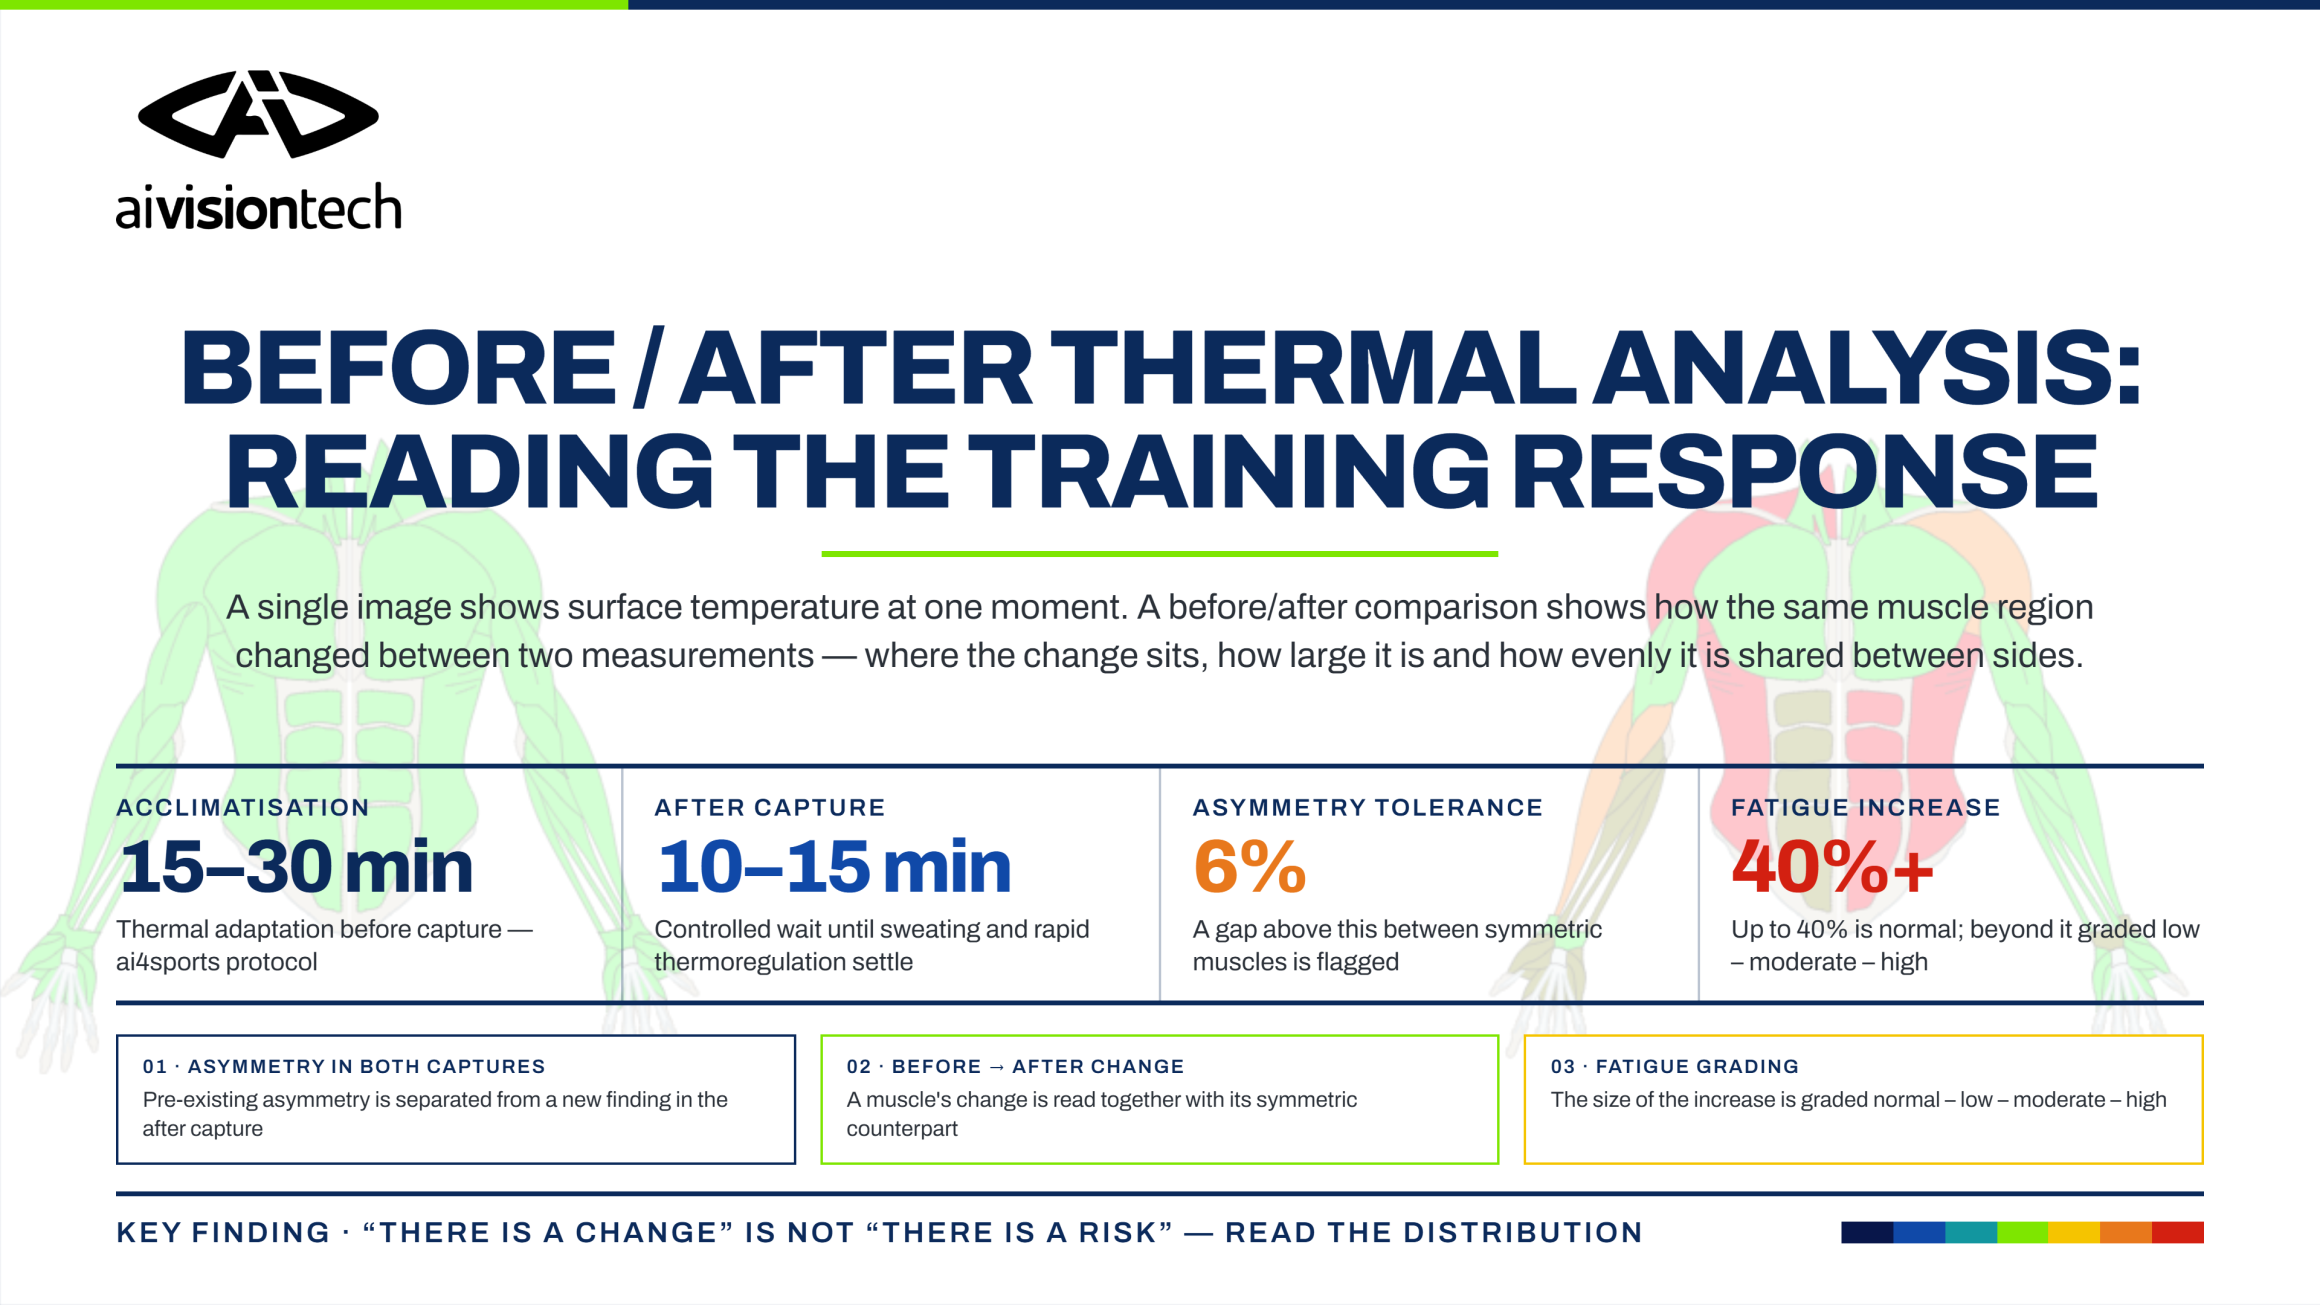
The TISEM consensus specifically emphasizes standardized participant preparation, environmental conditions, and acquisition protocols in sports thermography [4]. Before a pre-training measurement, the athlete should acclimatize to the capture environment. The ai4sports usage protocol recommends 15–30 minutes of thermal acclimatization before imaging.
After exercise, body temperature does not stabilize immediately. Even after muscle activity stops, sweating and evaporative heat loss from the skin continue for a period. This can temporarily reduce skin temperature, particularly during the first minutes after exercise. Studies examining post-exercise thermal responses have shown that sweating remains elevated after exercise and decreases markedly within about 8–9 minutes, while skin temperatures in different body regions may continue to change during the first 10–15 minutes [1],[5]. For this reason, rather than imaging immediately after exercise, ai4sports recommends a controlled waiting period of 10–15 minutes to reduce the influence of sweating and rapid thermoregulatory changes. This period is treated as a standardized measurement window intended to reduce early post-exercise thermal fluctuations.
How to Read the Comparison Report Step by Step
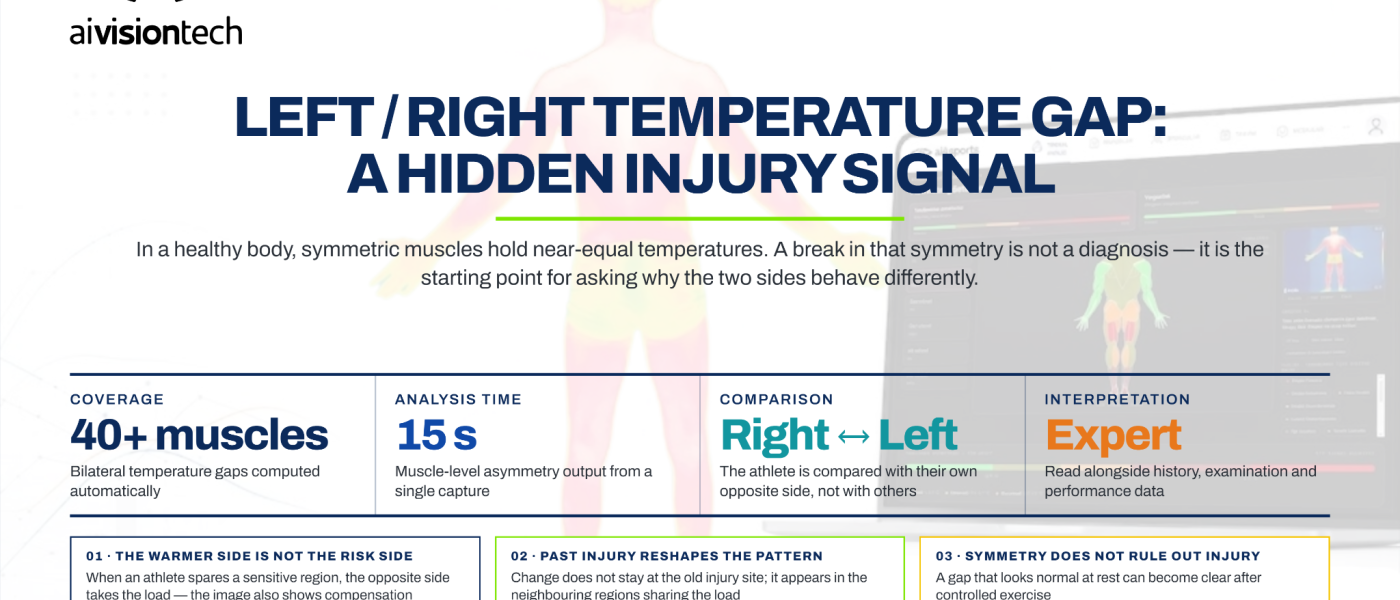
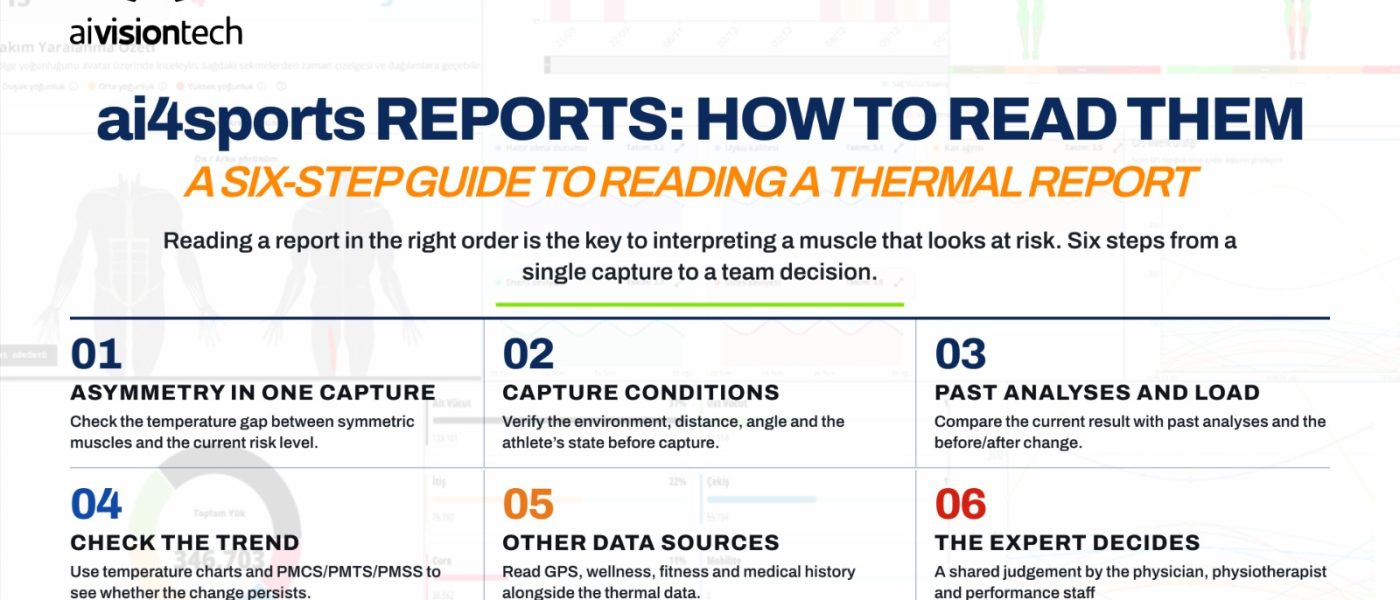
Pre- and post-training thermal images are first evaluated individually. Temperature differences between symmetrical muscles are reported in each image. This helps distinguish an asymmetry that was already present before training from a new change that appears afterward. You can review right-left asymmetry thresholds in our article Relationship Between Body-Region Thermal Asymmetry and Injury Risk.
Before/After analysis focuses on the Before → After change in the same muscle. In the ai4sports Before/After injury-risk analysis, up to a 6% difference in the change observed between symmetrical muscles is treated as within tolerance. A temperature-change difference above this level is flagged as an asymmetric response that may indicate uneven load distribution between sides.
In fatigue analysis, increases in high-temperature areas are evaluated separately. ai4sports presents this change in progressive levels: Normal, Low, Moderate, and High. Changes up to 40% are treated as normal, while increases above the progressive 40%, 60%, and 80% thresholds represent increasing loading levels.
These findings should not be interpreted in isolation. Thermal analysis reports and periodic scores such as PMCS, PMSS, and PMTS are more informative when reviewed together with the athlete's previous analyses to determine whether a change persists over time.
How Do We Distinguish Training Effects from Risk Signals?
A change in temperature after training is an expected physiological response. Blood flow, metabolic demand, and thermoregulation change in active muscles, so not every region is expected to remain identical to its pre-training state. Therefore, "there is a change" and "there is a risk" are not the same statement.
The distribution of the change is important. If two symmetrical muscles change in a similar direction, this is more consistent with balanced loading. A marked difference between sides, a change concentrated in only one region, or a difference that persists in subsequent measurements is considered within the risk-assessment context.
The 6% ai4sports tolerance is an internal product threshold used to standardize this comparison. The tolerance was selected in consideration of the tendency for a dominant side to reach a higher post-training temperature [6].
For this reason, sport discipline, dominant side, the athlete's periodic analyses, and clinical findings should be considered together in Before/After analysis.
What the Before/After Comparison Looks Like in ai4sports
In ai4sports, the Before and After captures are first evaluated separately; each report shows injury and fatigue maps for its own date. When the two captures are placed side by side, a comparative view is produced: the left side shows injury and fatigue maps from the earlier capture, while the right side shows the corresponding maps from the later capture. This makes it possible to read how the same muscle regions changed between two dates on a single screen.
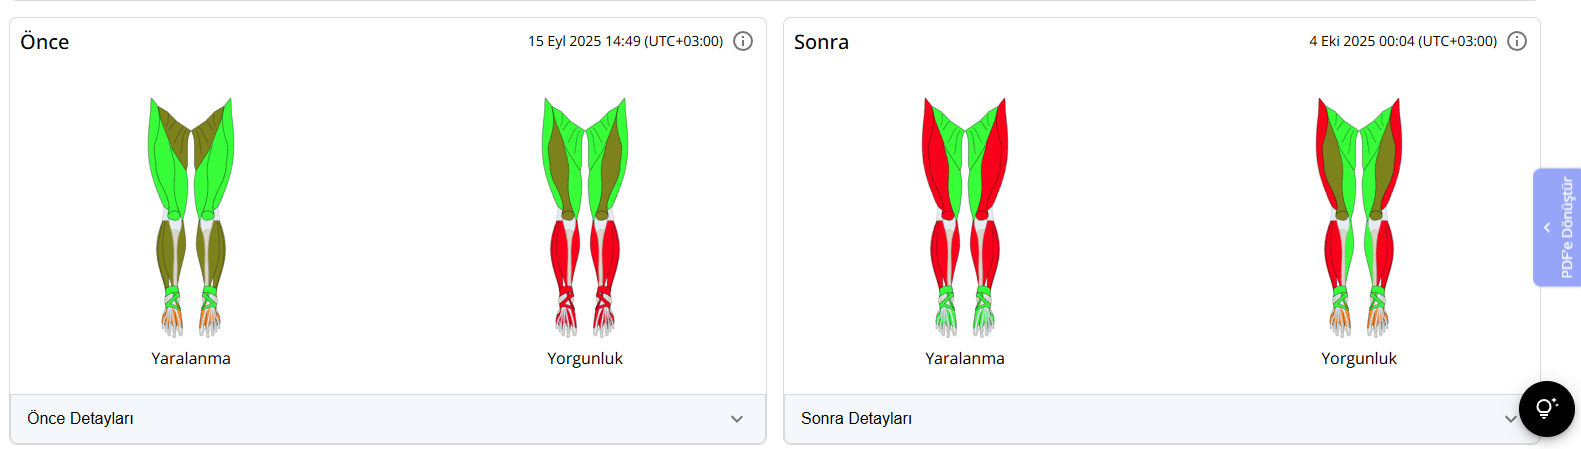
In this comparative view, the color change on the injury map represents a change in regional risk level, while the color change on the fatigue map represents a thermal increase associated with training load. For example, if a region such as the rectus femoris or tibialis changes from lower-risk tones in the earlier capture to higher-risk tones in the later capture, it indicates that the region responded differently between the two dates.
A comparative report can be reviewed in the following order:
- Check right-left asymmetry in both captures. An asymmetry already present in the Before capture should not be confused with a new finding in the After capture.
- Calculate the Before → After change in the same muscle. A regional color change should not be interpreted alone; it should be read together with how much it differs from its symmetrical counterpart. A difference above 6% is flagged as a signal suggesting that the load may not have been distributed equally between sides.
- Grade the magnitude of the increase on the fatigue side. Changes up to 40% are considered within the normal range, while increases above this threshold are graded as Low, Moderate, and High loading levels that warrant closer follow-up.
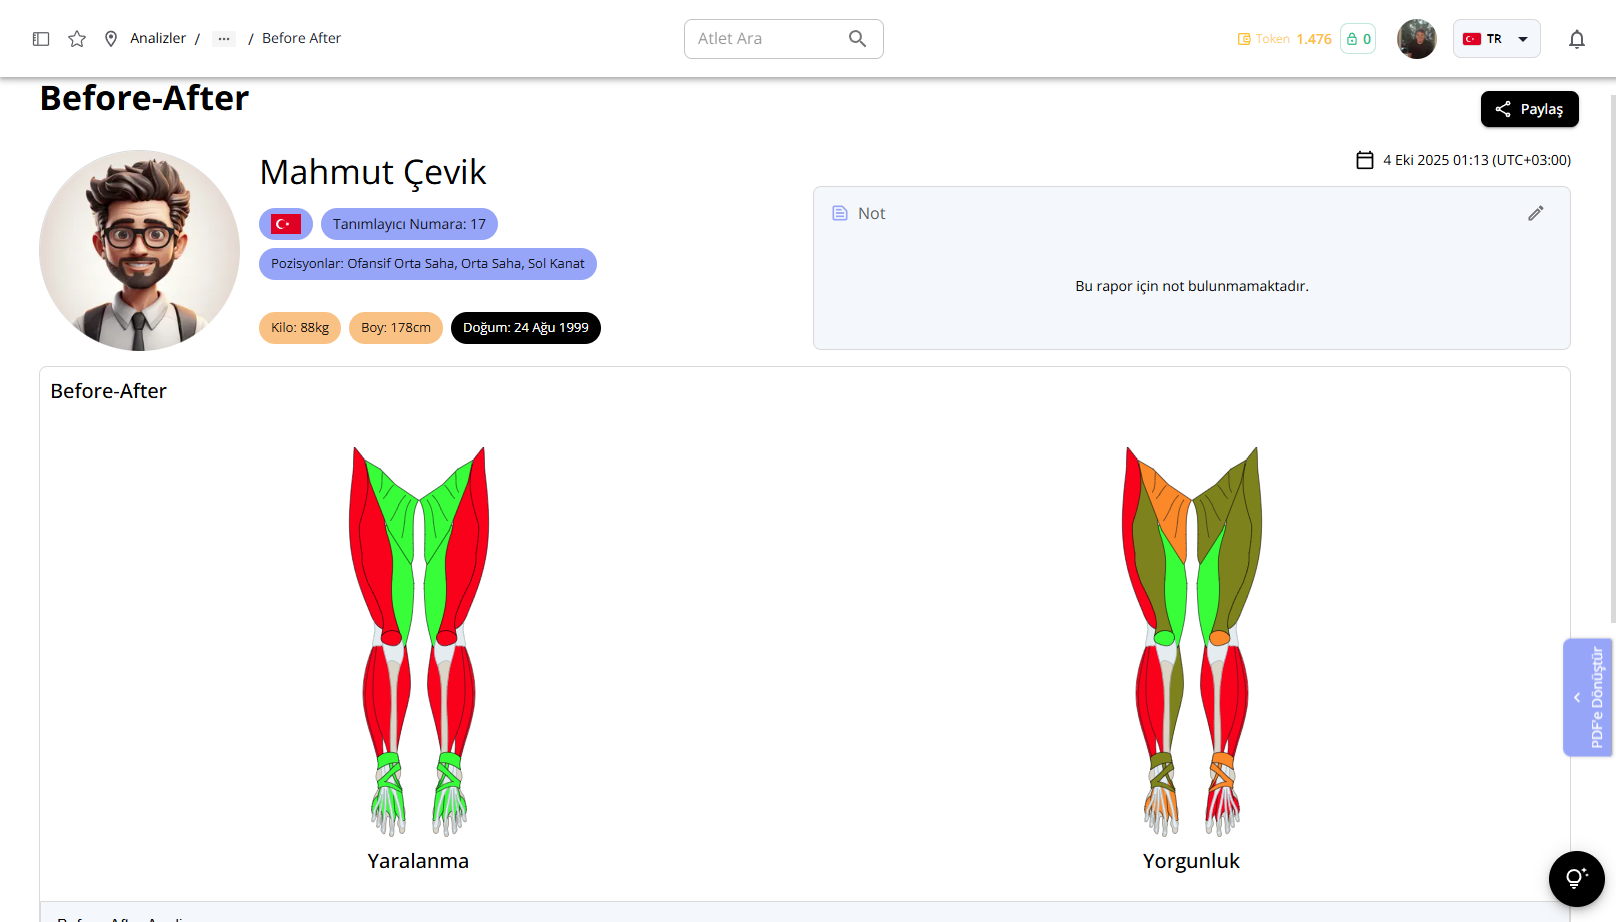
A change concentrated in a specific region and diverging from the symmetrical counterpart suggests that the region responded differently to the training load. However, this does not by itself constitute an injury diagnosis; it should be evaluated by the health team together with the athlete's periodic data, clinical examination findings, and symptoms when present.
The output is not a diagnosis. It is a structured decision-support report showing how training-related changes are distributed across muscle regions. To view a Before/After report for your own athletes, you can request ai4sports demo access.
Seeing Change Tells More Than a Single Image
A single thermal image shows the athlete's surface temperature at that moment. Before/After analysis makes visible how training, rest, or recovery changes the same muscle regions over time. The valuable information is not only whether temperature rises or falls, but where the change occurs, how large it is, and how balanced it is between sides.
For this reason, Before/After analysis supports interpretation of an athlete's response to loading within periodic monitoring rather than drawing conclusions from a single measurement.
References
- Masur, L., Brand, F., & Düking, P. (2024). Response of infrared thermography related parameters to (non-)sport specific exercise and relationship with internal load parameters in individual and team sport athletes—a systematic review. Frontiers in Sports and Active Living, 6, 1479608. https://doi.org/10.3389/fspor.2024.1479608
- Bayrak, A., Çevik, M., & Ceylan, M. (2026). Thermal asymmetry in football players following ankle injury: Findings related to training load. In Artificial Intelligence over Infrared Images for Medical Applications (AIIIMA 2025), Lecture Notes in Computer Science, Vol. 16308, 128–142. Springer. https://doi.org/10.1007/978-3-032-10990-3_9
- Ergene, M. C., Bayrak, A., & Ceylan, M. (2020). Tracking the injury recovery of professional football players with infrared thermography: Preliminary Study. Avrupa Bilim ve Teknoloji Dergisi, 207–213. https://doi.org/10.31590/ejosat.805151
- Moreira, D. G., Costello, J. T., Brito, C. J., Adamczyk, J. G., Ammer, K., Bach, A. J. E., et al. (2017). Thermographic imaging in sports and exercise medicine: A Delphi study and consensus statement on the measurement of human skin temperature. Journal of Thermal Biology, 69, 155–162. https://doi.org/10.1016/j.jtherbio.2017.07.016
- Torii, M., Yamasaki, M., Sasaki, T., & Nakayama, H. (1992). Fall in skin temperature of exercising man. British Journal of Sports Medicine, 26(1), 29–32.
- Gómez-Carmona, P. M., et al. (2024). Preliminary Application of Infrared Thermography to Monitoring of Skin Temperature Asymmetries in Professional Padel Players. Sensors, 24(14), 4534. https://doi.org/10.3390/s24144534