


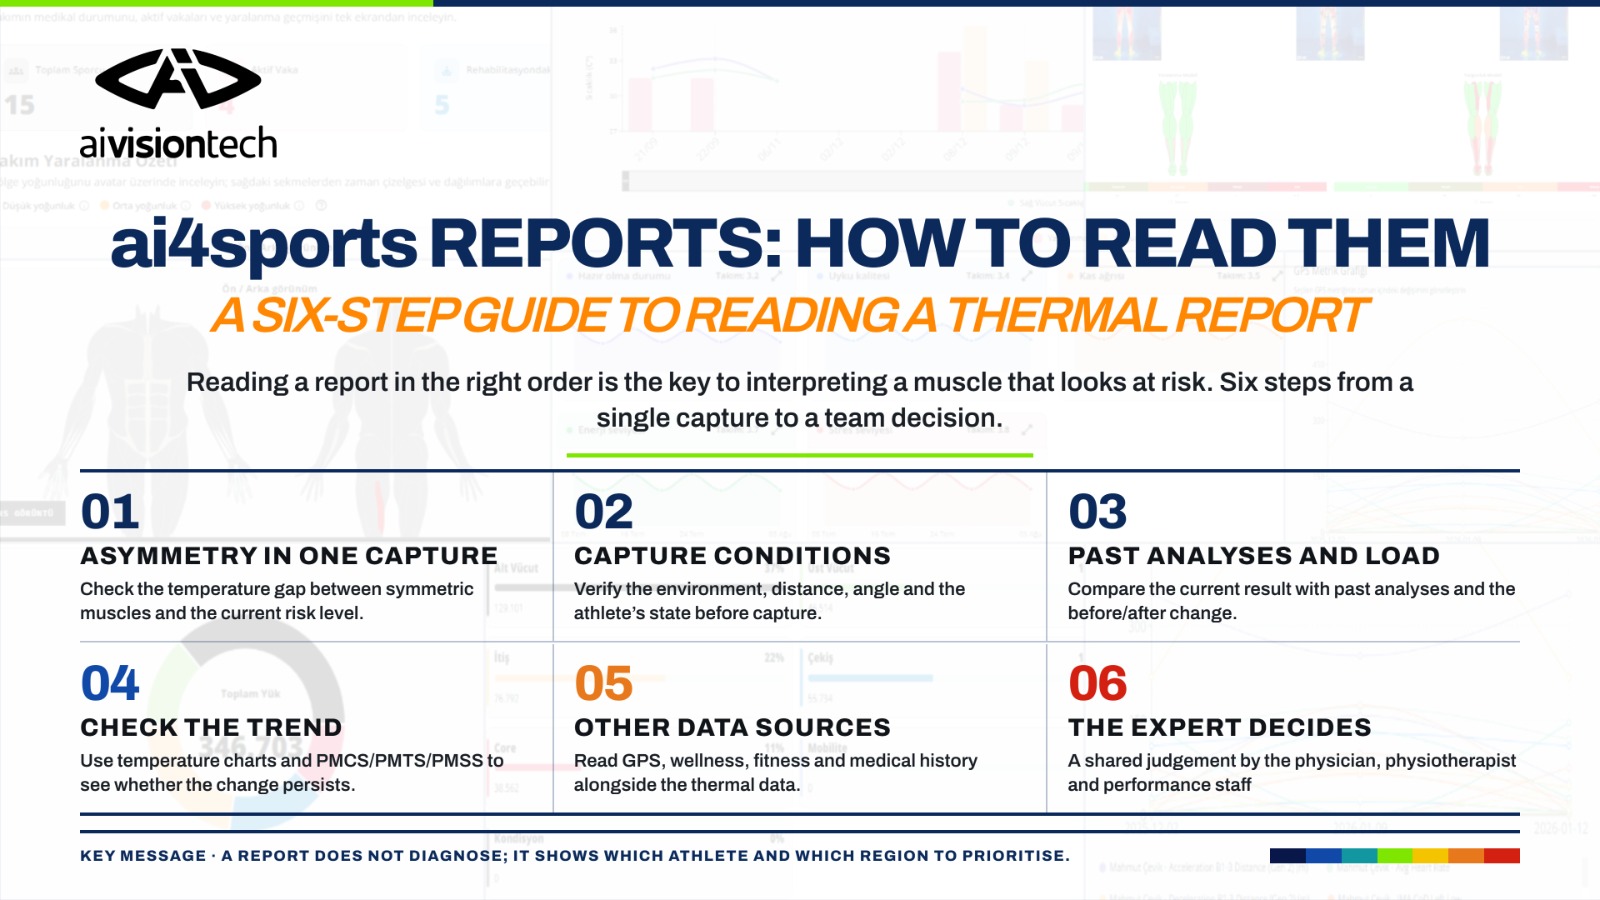
Step 1. Start with Asymmetry in a Single Measurement
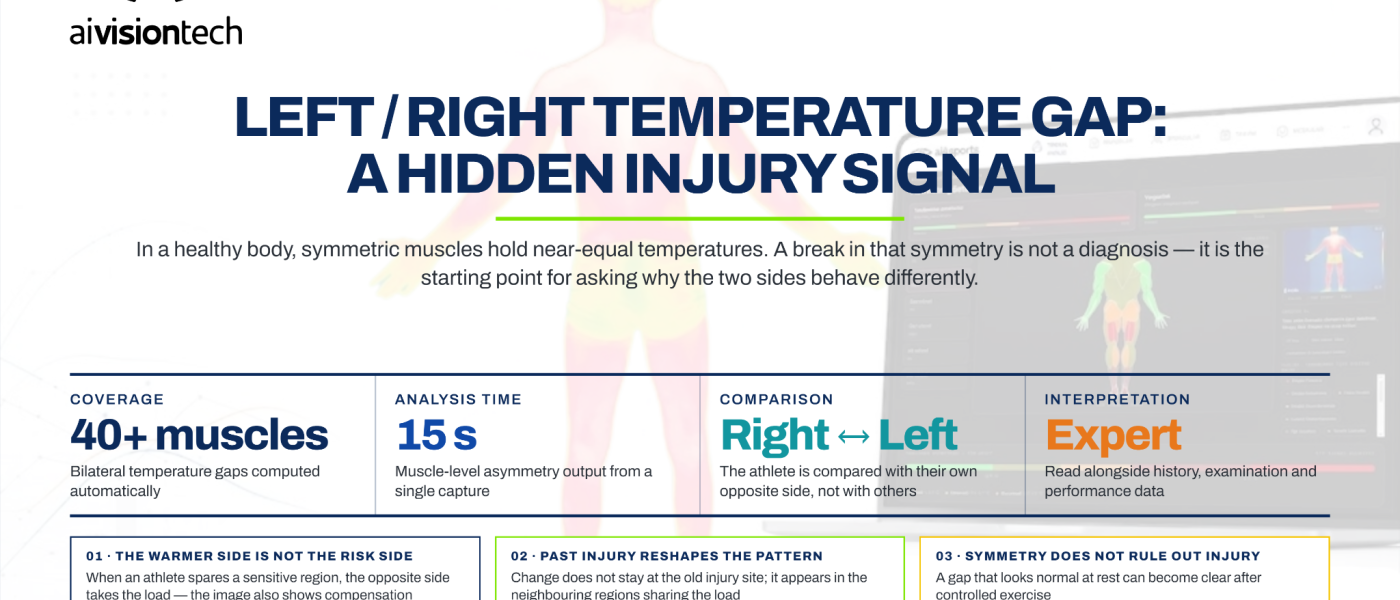
A single thermal analysis shows the athlete’s condition at the time of capture. ai4sports compares symmetrical muscle groups on the right and left sides and evaluates the temperature difference between them.
Under normal conditions, very small temperature differences are expected between symmetrical muscle regions. In ai4sports, differences of 0.4°C or below are treated as “Normal.” Asymmetries above this value indicate progressively higher risk levels.
However, a high asymmetry does not automatically mean an injury is present. It may result from asymmetrical training load, greater use of the dominant side, previous injuries, ongoing rehabilitation, or a recent high-intensity session.
For this reason, a single thermal analysis is best viewed as a snapshot of the athlete’s current state. To understand the possible reasons behind a risk indication, the second and third steps should also be considered.
Step 2. Check the Measurement Conditions
As discussed in our previous articles, thermal imaging is sensitive to environmental conditions. Room temperature, humidity, airflow, capture distance, camera angle, and the athlete’s state before the scan can all affect the measured temperatures.
Therefore, an unusual value in a report should not immediately be interpreted as evidence that the athlete is at increased injury risk. First verify: was the measurement captured under appropriate conditions?
Allowing the athlete to acclimatize to the capture environment, keeping them away from direct sunlight or strong airflow, and applying the same capture protocol as consistently as possible across different days improves comparability.
For a more detailed overview of environmental, camera, and athlete preparation before thermal capture, see What Is Thermal Imaging and How Is It Used in Sports?.
Once the measurement conditions are verified, the athlete’s previous analyses can be reviewed to investigate the context of the current result in more detail.
Step 3. Compare with Past Analyses and Training Load
Interpreting the current risk level together with the athlete’s previous assessments provides a more integrated view.
For example, a muscle region classified as “Monitor” does not necessarily represent a new negative development. If the athlete previously had an injury in the same area, is in a return-to-play (RTP) process, and the region had previously been classified at “Attention” or “Urgent” levels, a current “Monitor” result may actually indicate improvement rather than increasing risk. A single measurement should therefore not be interpreted in isolation; previous analyses and the direction of change during rehabilitation should be considered together.
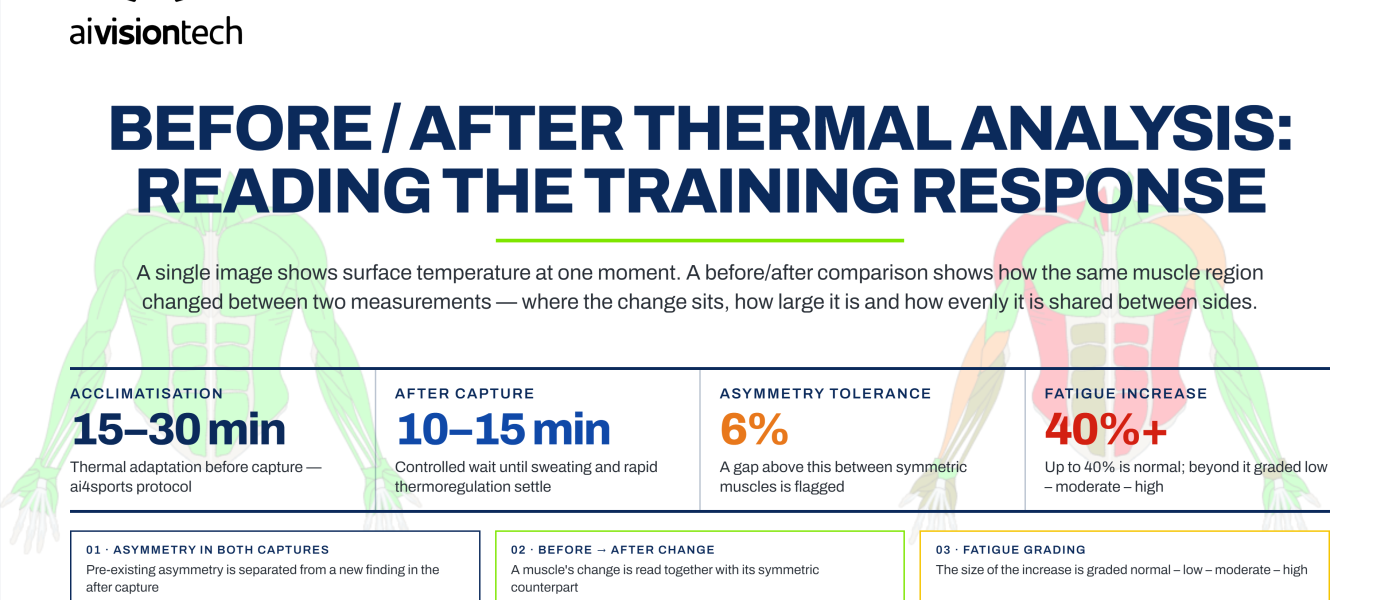
It is also important whether the analysis was performed before or after training when assessing dominant-side and load effects. Pre-training analyses should reflect the athlete’s resting state, where fewer high-risk findings and fewer high-temperature regions are generally expected. After training, some increase in temperature difference and high-temperature areas may be considered normal depending on dominant-side use and training load. The ai4sports Before/After analysis compares changes in the same muscle regions between pre- and post-training captures. This makes it possible to examine the physiological effect of training, how both sides respond to load, and how closely the athlete returns to their previous thermal state after recovery.
This approach is particularly useful for pre/post-training comparisons, congested microcycles, and rehabilitation processes.
We explain the Before/After workflow in more detail in Before/After Thermal Analysis: Evaluating Training Effects.
Step 4. Read Asymmetry Together with Temperature Trends
When an athlete is in a congested match schedule, rehabilitation period, or return-to-play (RTP) process, the latest analysis alone may not be sufficient. The change over time can be more informative.
With ai4sports, temperature trend charts can be generated for each muscle group over a selected date range. This helps show whether an increase in a region is a one-off event, persists across several analyses, or gradually returns toward baseline.
Periodic scores such as PMCS, PMSS, and PMTS can also be used to follow the athlete’s overall direction across recent analyses. Rather than focusing on a single muscle group, these scores provide a broader view of how the athlete’s thermal profile changes over time.
For example, a moderate asymmetry that persists across several measurements may be more meaningful than a single isolated value. Conversely, a change that appears after an intense session but quickly declines in a recovery measurement should be interpreted differently.
The key question becomes:
“Is this change temporary, or is it becoming a trend?”
Step 5. Do Not Read Thermal Data in Isolation
Athlete health cannot be managed through a single data source. Thermal analysis provides a useful physiological data layer, but it can be incomplete without training-load, performance, and medical-history context.
ai4sportsHUB is therefore designed not only to manage thermal images, but also to bring different data types into the same monitoring environment. GPS data, wellness scores, fitness history, medical notes, and previous analyses can be evaluated together.
For example, if increasing thermal asymmetry is observed in a player’s calf region, the same period can also be checked for high sprint load in GPS data, a decline in wellness scores, or a recent injury. Combining these signals provides more context for the thermal finding.
The aim is not to generate a separate alarm from every data source, but to combine different data from the same athlete into one coherent picture.
This allows coaches, physiotherapists, and medical staff to evaluate the same player through a shared data framework rather than separate viewpoints.
Step 6. The Final Decision Belongs to the Expert
Thermal imaging is not a gold-standard diagnostic method. ai4sports should not be used to make a definitive injury diagnosis; it is intended to help prioritize athletes and muscle regions that may require closer attention.
High or persistent thermal asymmetry does not automatically mean that training load should be reduced or treatment should begin. Symptoms, physical examination, training history, and other available data should be evaluated first.
If concern about a structural injury increases, imaging methods such as MRI, ultrasound, X-ray, or CT when appropriate may be used. Unlike the physiological changes shown by thermography, these methods are intended to assess anatomical structures.
For this reason, one of the most valuable roles of ai4sports is to make it easier to see which athlete should be reviewed first in a large squad and to provide the medical team with structured decision-support data.
The final assessment should always be based on the shared judgement of the sports physician, physiotherapist, and athletic performance staff.
Conclusion: Reading the Report Is More Than Seeing Risk
A single thermal report provides information about the athlete’s current thermal state, but it is not always sufficient for a final decision on its own. Previous analyses, responses to training, and periodic changes should also be considered during risk assessment.
ai4sportsHUB makes it possible to review other data such as GPS, wellness questionnaires, medical history, and fitness load in an integrated way. The final decision should then be made by the health and performance team after evaluating these data together.