


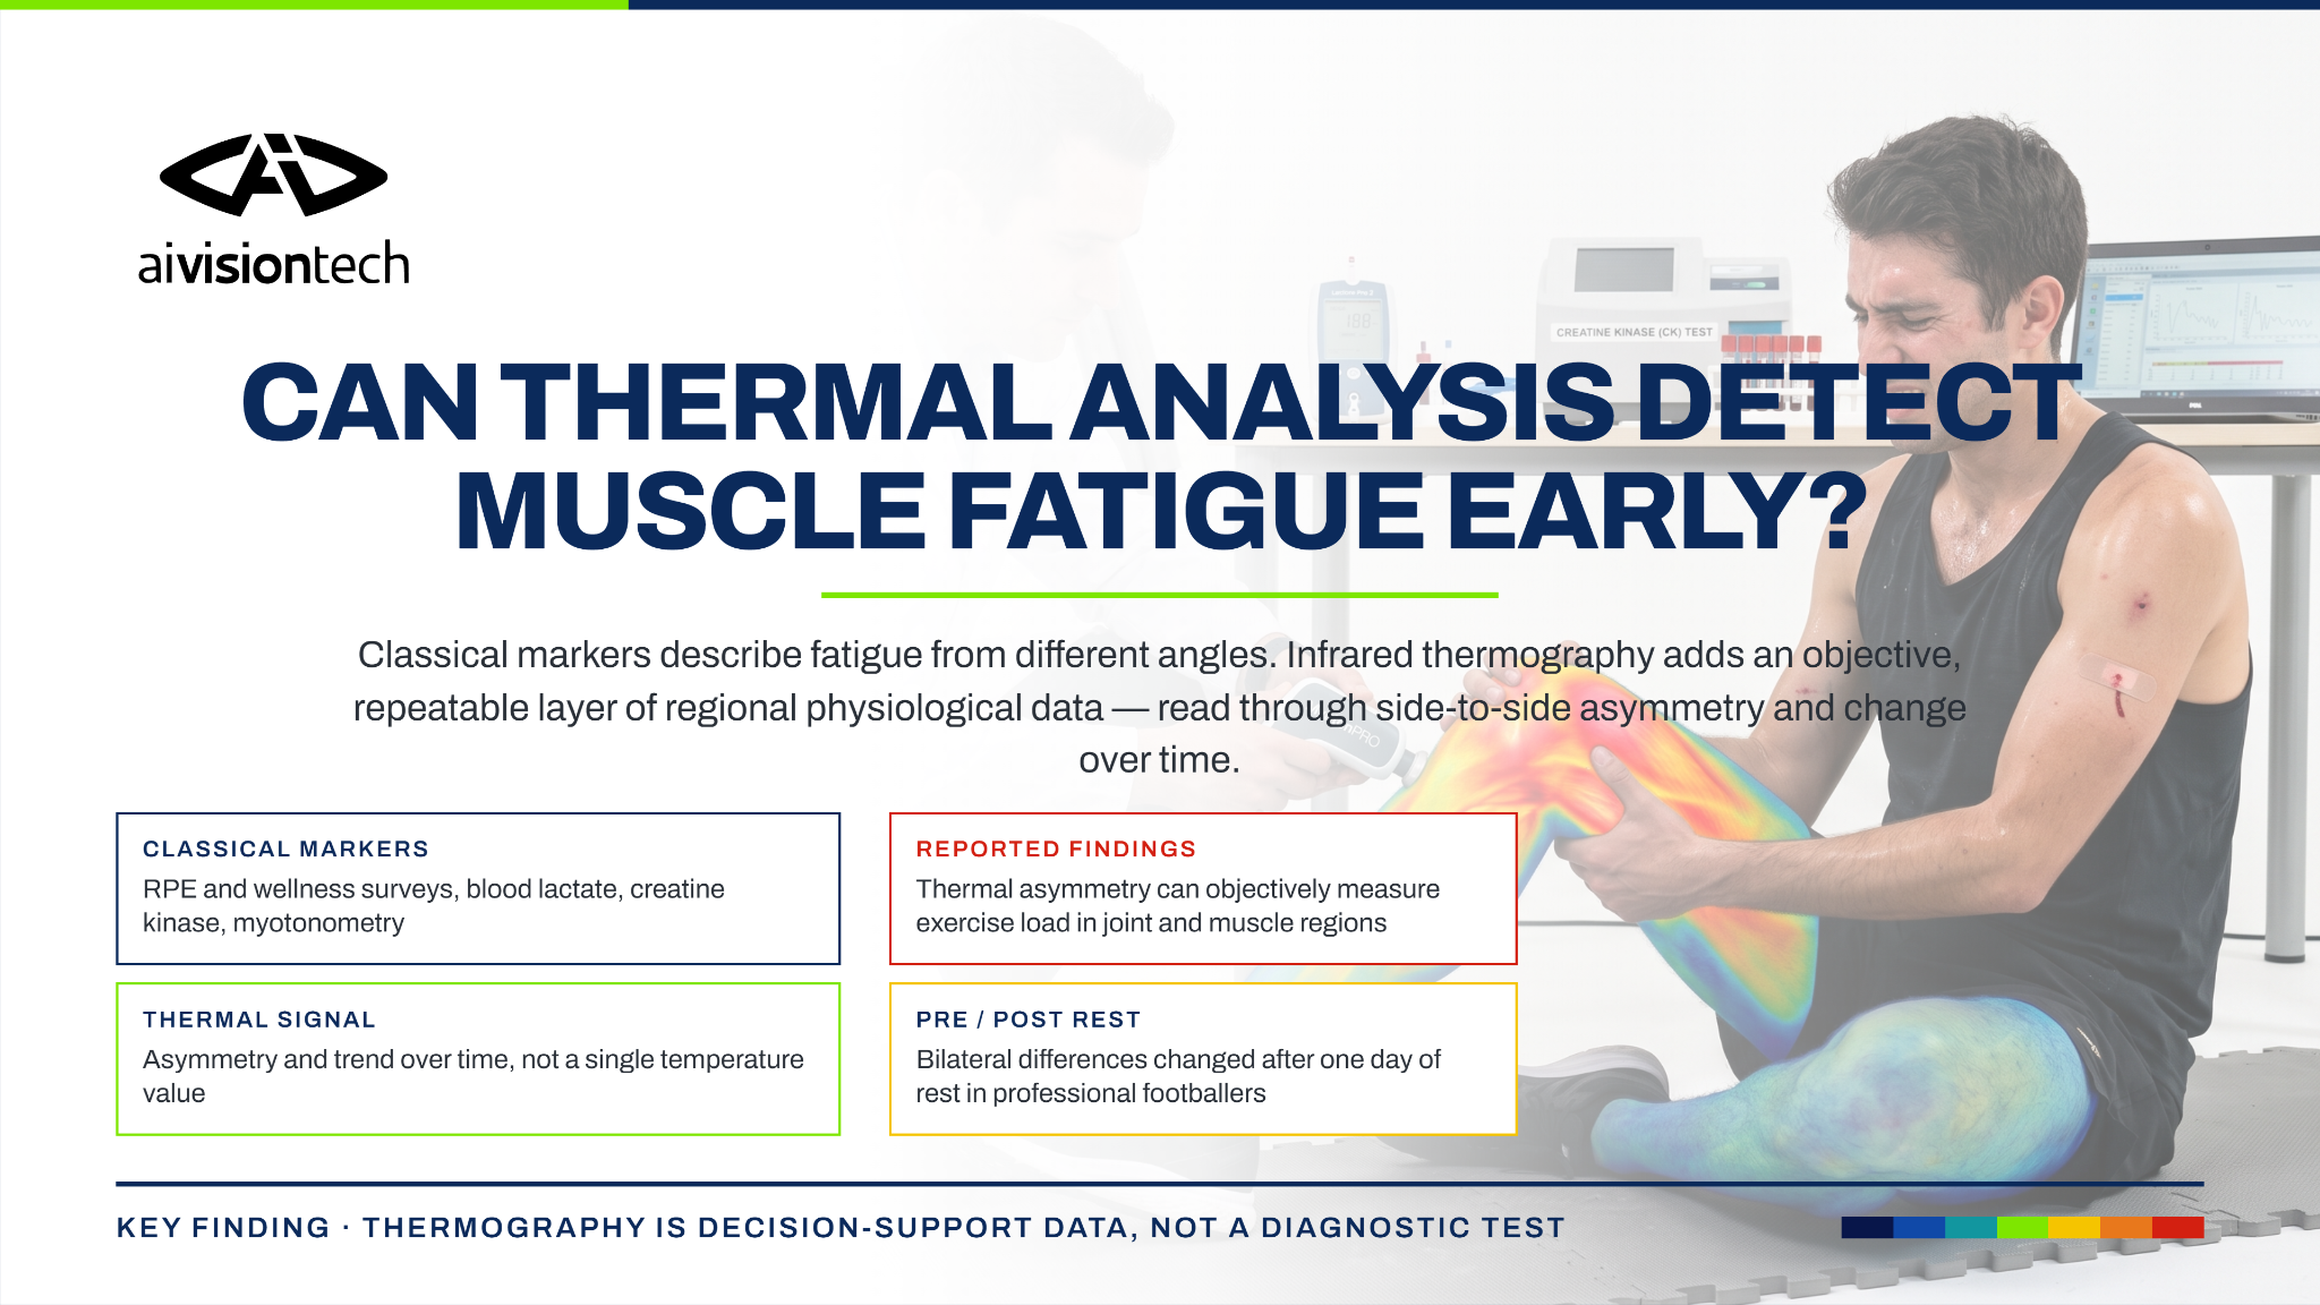
Classical methods measure fatigue from different angles; thermal analysis adds a regional, repeatable layer of physiological data.
What Is Muscle Fatigue?
Muscle fatigue is a temporary reduction in the muscle's ability to produce force or power following prolonged muscular activity [1]. During intense exercise, changes in energy metabolism, muscle-fibre excitability and neuromuscular transmission can make force production more difficult. Acute fatigue commonly appears after a single demanding training session or competition, and its effects may lessen with adequate recovery.
When loading continues before recovery is complete, fatigue can accumulate over several days and affect performance for longer. Muscle fatigue should therefore be evaluated not only during exercise, but also in relation to the athlete's ability to recover between sessions. Because recovery capacity differs between athletes, regular monitoring of fatigue markers is important.
What Are the Signs of Muscle Fatigue?
Muscle fatigue cannot be identified from a single sign. Subjective sensations, performance outputs and physiological measurements should be considered together. Since the same load can produce different levels of fatigue in different athletes, deviation from the athlete's own normal values is particularly important.
- Loss of force or power: The muscles cannot perform the same movement at their previous power level.
- Pain and tenderness: Stress after intense loading may be perceived as soreness, cramp or spasm.
- Reduced movement quality: Fatigue-related compensation or changes in neuromuscular control may occur.
- Higher perceived exertion: The same training load feels more difficult to the athlete.
- Prolonged recovery: Effects of the previous session persist into the next training session.
- Regional physiological changes: Thermal asymmetry and inflammation-related changes may provide additional information about the local response to load.
Classical Fatigue-Monitoring Methods and Their Limitations
There is no single standard measurement for monitoring muscle fatigue. RPE and wellness questionnaires offer a practical way to follow perceived fatigue, muscle soreness, sleep and recovery, but they are subjective. Blood lactate provides short-term information about metabolic load during intense exercise; it does not represent fatigue as a whole. Creatine kinase (CK) may rise in association with cellular stress and muscle damage, particularly after intense or eccentric loading, but it varies substantially between individuals and its timing does not necessarily match acute fatigue [2].
For this reason, combining biochemical, performance and subjective indicators is generally more informative in athlete monitoring [2].
How Does Thermal Analysis Capture a Fatigue-Related Signal?
During and after exercise, muscle metabolic activity, blood flow, thermoregulation and heat exchange with the environment change. The surface expression of these physiological processes can be measured with a thermal camera. The article What Do Muscle-Group Temperature Maps Tell Us? explains this regional approach in more detail.
However, a warmer region does not automatically mean a fatigued region, and a cooler region does not automatically mean a normal one. Increased surface temperature around a muscle may be associated with local blood flow or inflammatory responses, while a decrease may result from vasoconstriction, sweating, heat redistribution or other thermoregulatory responses. Studies have reported associations between exercise-induced muscle fatigue and changes in skin temperature, although the relationship can vary by body region and the type of loading applied [3].
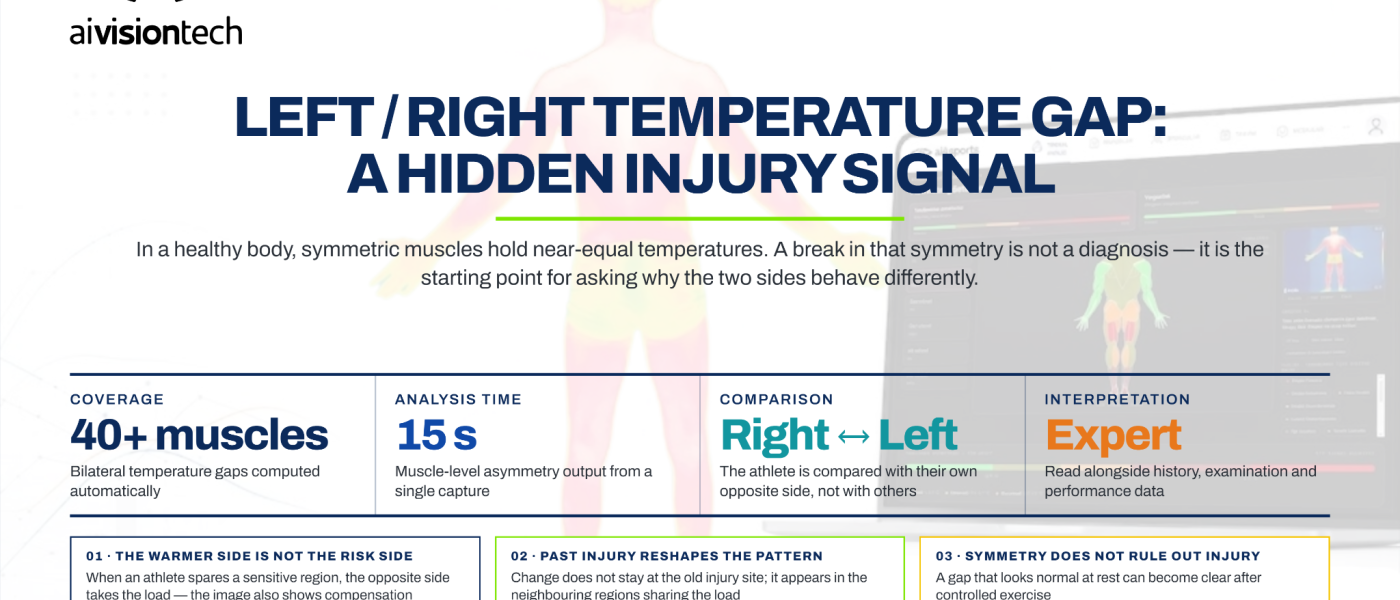
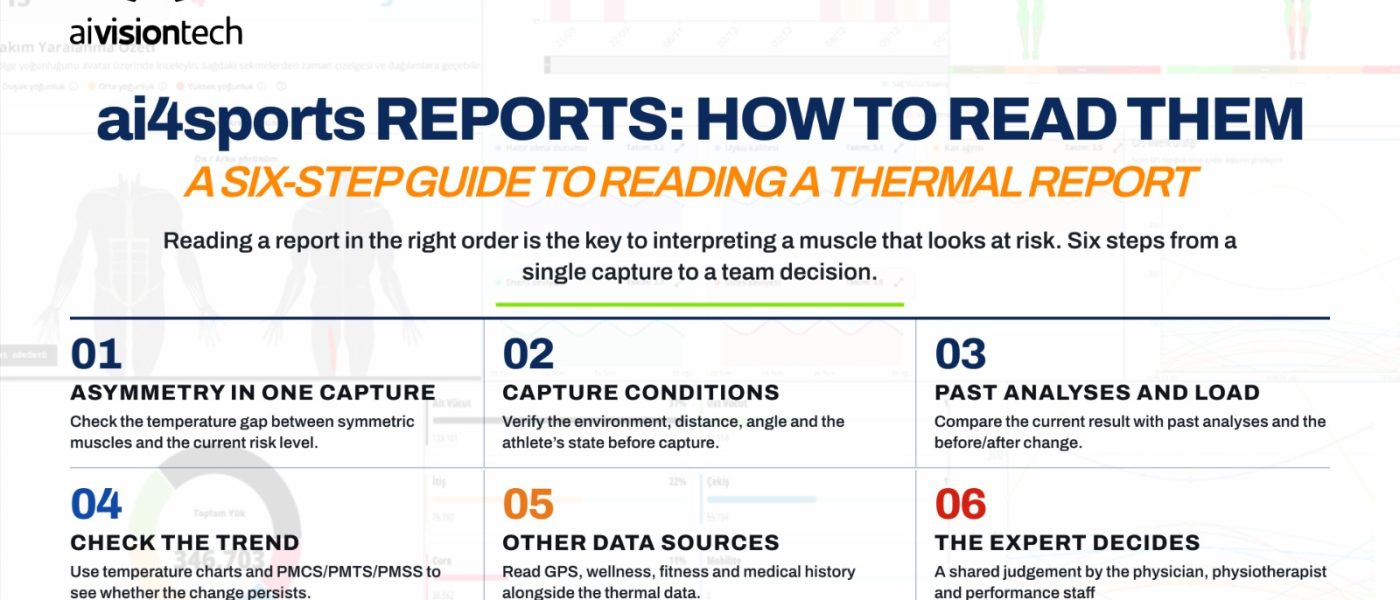
Accordingly, regional temperature increases and decreases assessed with ai4sports should not be interpreted as diagnoses on their own. Thermal change becomes more meaningful when evaluated through side-to-side asymmetry and its trend over time rather than as a single temperature value.
In a study by Bayrak and colleagues involving football players with a history of ankle injury, the thermal response to training load was monitored across different anatomical regions. Early evaluations showed more pronounced changes in thermal asymmetry around the ankle and patellar tendon, while later observations also found changes in medial and lateral calf temperature differences [4]. These findings indicate that the thermal response to training load may not remain confined to a previously injured region and can be monitored across different parts of the lower extremity.
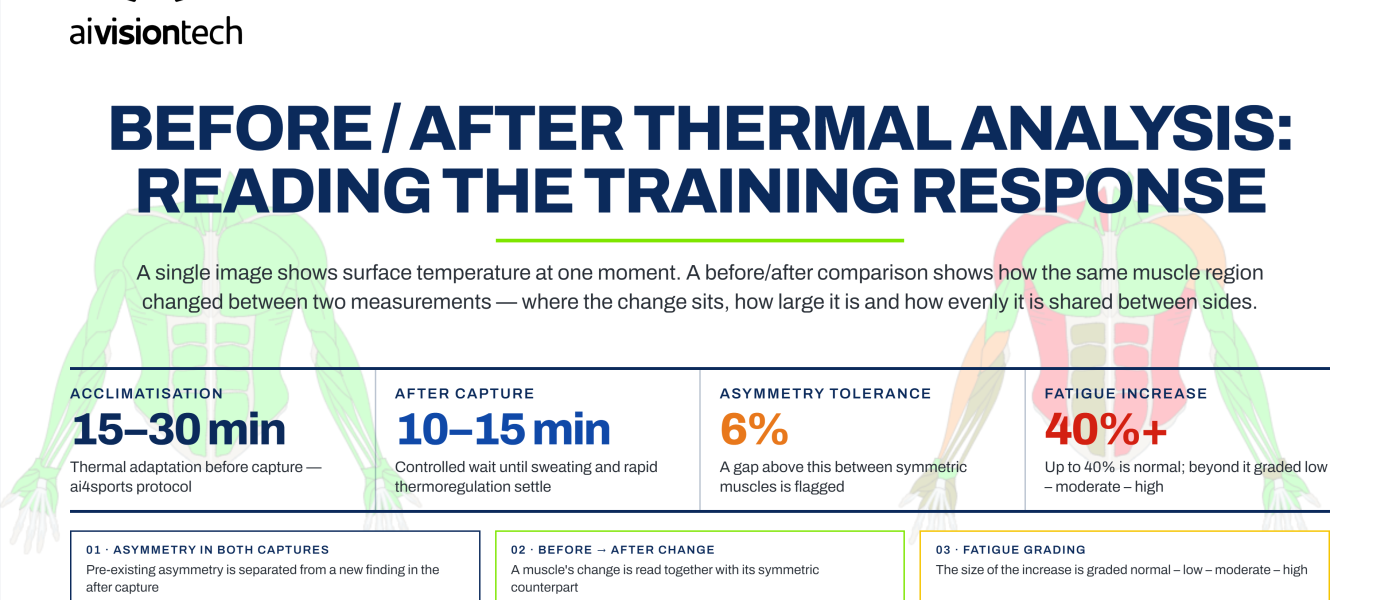
Similarly, in a preliminary study by Ergene and colleagues involving professional footballers, thermal images of problem regions were compared before rest and after one day of rest. Changes in temperature distribution and bilateral differences after rest suggest that thermography may be used not only as a single snapshot, but also as a periodic measurement tool for following thermal change during recovery [5].
Thermography should therefore be considered decision-support data that makes physiological changes potentially associated with fatigue and loading objectively visible, rather than a test that directly diagnoses fatigue. Acute or chronic injury, inflammation, circulation, training load and other physiological factors can contribute to thermal change, so the result should be interpreted by an appropriate professional.
How Can Fatigue Data Inform Training Planning?
The practical value of fatigue markers lies in how they guide actions after measurement. If a muscle group shows a response that differs from an athlete's normal values, training load, recovery status and other performance data can be considered together to individualize the programme.
Recovery sessions are generally planned around low-intensity work that supports recovery rather than creating high additional load. The aim is not necessarily complete inactivity, but selecting a load appropriate to the athlete's current physiological state. Thermal analysis may add information to decisions about reducing load, allowing more recovery time or monitoring an athlete more closely by showing which muscle groups have unusual or persistent changes [4].
What Can Help Reduce Muscle Fatigue?
Rather than relying on one method, the core approach to fatigue management is maintaining an appropriate balance between training load and recovery. Individualized load planning, sufficient sleep, appropriate nutrition and hydration, and regular monitoring of recovery status are key components [6],[7],[8].
- Sleep: Regular, sufficient sleep is a fundamental part of physical and neuromuscular recovery.
- Nutrition and hydration: Energy, nutrient and fluid intake appropriate to training load support recovery.
- Active recovery: Suitable low-intensity activities can form part of a recovery plan.
- Load management: Intense sessions and recovery periods should be balanced according to the athlete's current status.
- Periodic monitoring: Subjective feedback, performance and physiological indicators should be followed together.
Conclusion: Track the Change, Not Just the Hot or Cold Area
Thermal analysis does not diagnose muscle fatigue on its own, but it can make the regional physiological response to training load objectively and repeatedly visible. Its main value lies not in identifying a single hot or cold region, but in tracking deviations from the athlete's own baseline, side-to-side asymmetries and the direction of those changes over time.
When used alongside subjective feedback, performance measurements and clinical assessment, thermography can provide a complementary data layer for individualized load and risk management.
References
- Kent-Braun, J. A., Fitts, R. H., & Christie, A. (2012). Skeletal muscle fatigue. Comprehensive Physiology, 2(2), 997–1044.
- Mendes, B., et al. (2022). Seasonal training load monitoring among elite level soccer players: Perceived exertion and creatine kinase variations.
- Hadžić, V., Širok, B., Malneršič, A., & Čoh, M. (2019). Can infrared thermography be used to monitor fatigue during exercise? A case study. Journal of Sport and Health Science, 8(1), 89–92.
- Bayrak, A., Çevik, M., & Ceylan, M. (2026). Thermal asymmetry in football players following ankle injury: Findings related to training load. In Artificial Intelligence over Infrared Images for Medical Applications (AIIIMA 2025), Lecture Notes in Computer Science, Vol. 16308, 128–142. Springer, Cham. https://doi.org/10.1007/978-3-032-10990-3_9
- Ergene, M. C., Bayrak, A., & Ceylan, M. (2020). Tracking the injury recovery of professional football players with infrared thermography: Preliminary study. European Journal of Science and Technology, Special Issue, 207–213. https://doi.org/10.31590/ejosat.805151
- Halson, S. L. (2014). Monitoring training load to understand fatigue in athletes. Sports Medicine, 44(Suppl 2), S139–S147.
- Schwellnus, M., et al. (2016). How much is too much? (Part 2) International Olympic Committee consensus statement on load in sport and risk of illness. British Journal of Sports Medicine, 50(17), 1043–1052.
- Walsh, N. P., et al. (2021). Sleep and the athlete: Narrative review and 2021 expert consensus recommendations. British Journal of Sports Medicine, 55(7), 356–368.