


What Is a Temperature Map and How Is It Created?
Thermal imaging is the process of converting temperature values obtained with a thermal camera into interpretable images using a selected color palette. Learn how thermal images are acquired in What Is Thermal Imaging and How Is It Used in Sports?.
Each thermal analysis process first begins by separating the region of interest from the background. The set of temperature values obtained after separating areas or objects of interest from the background in a thermal image is referred to as a temperature map (temperature matrix). Temperature maps can be extracted using the drawing tools provided with thermal-camera software. However, because these analyses are manual and region-of-interest creation tools may have limited precision, the process can be time-consuming and less accurate.
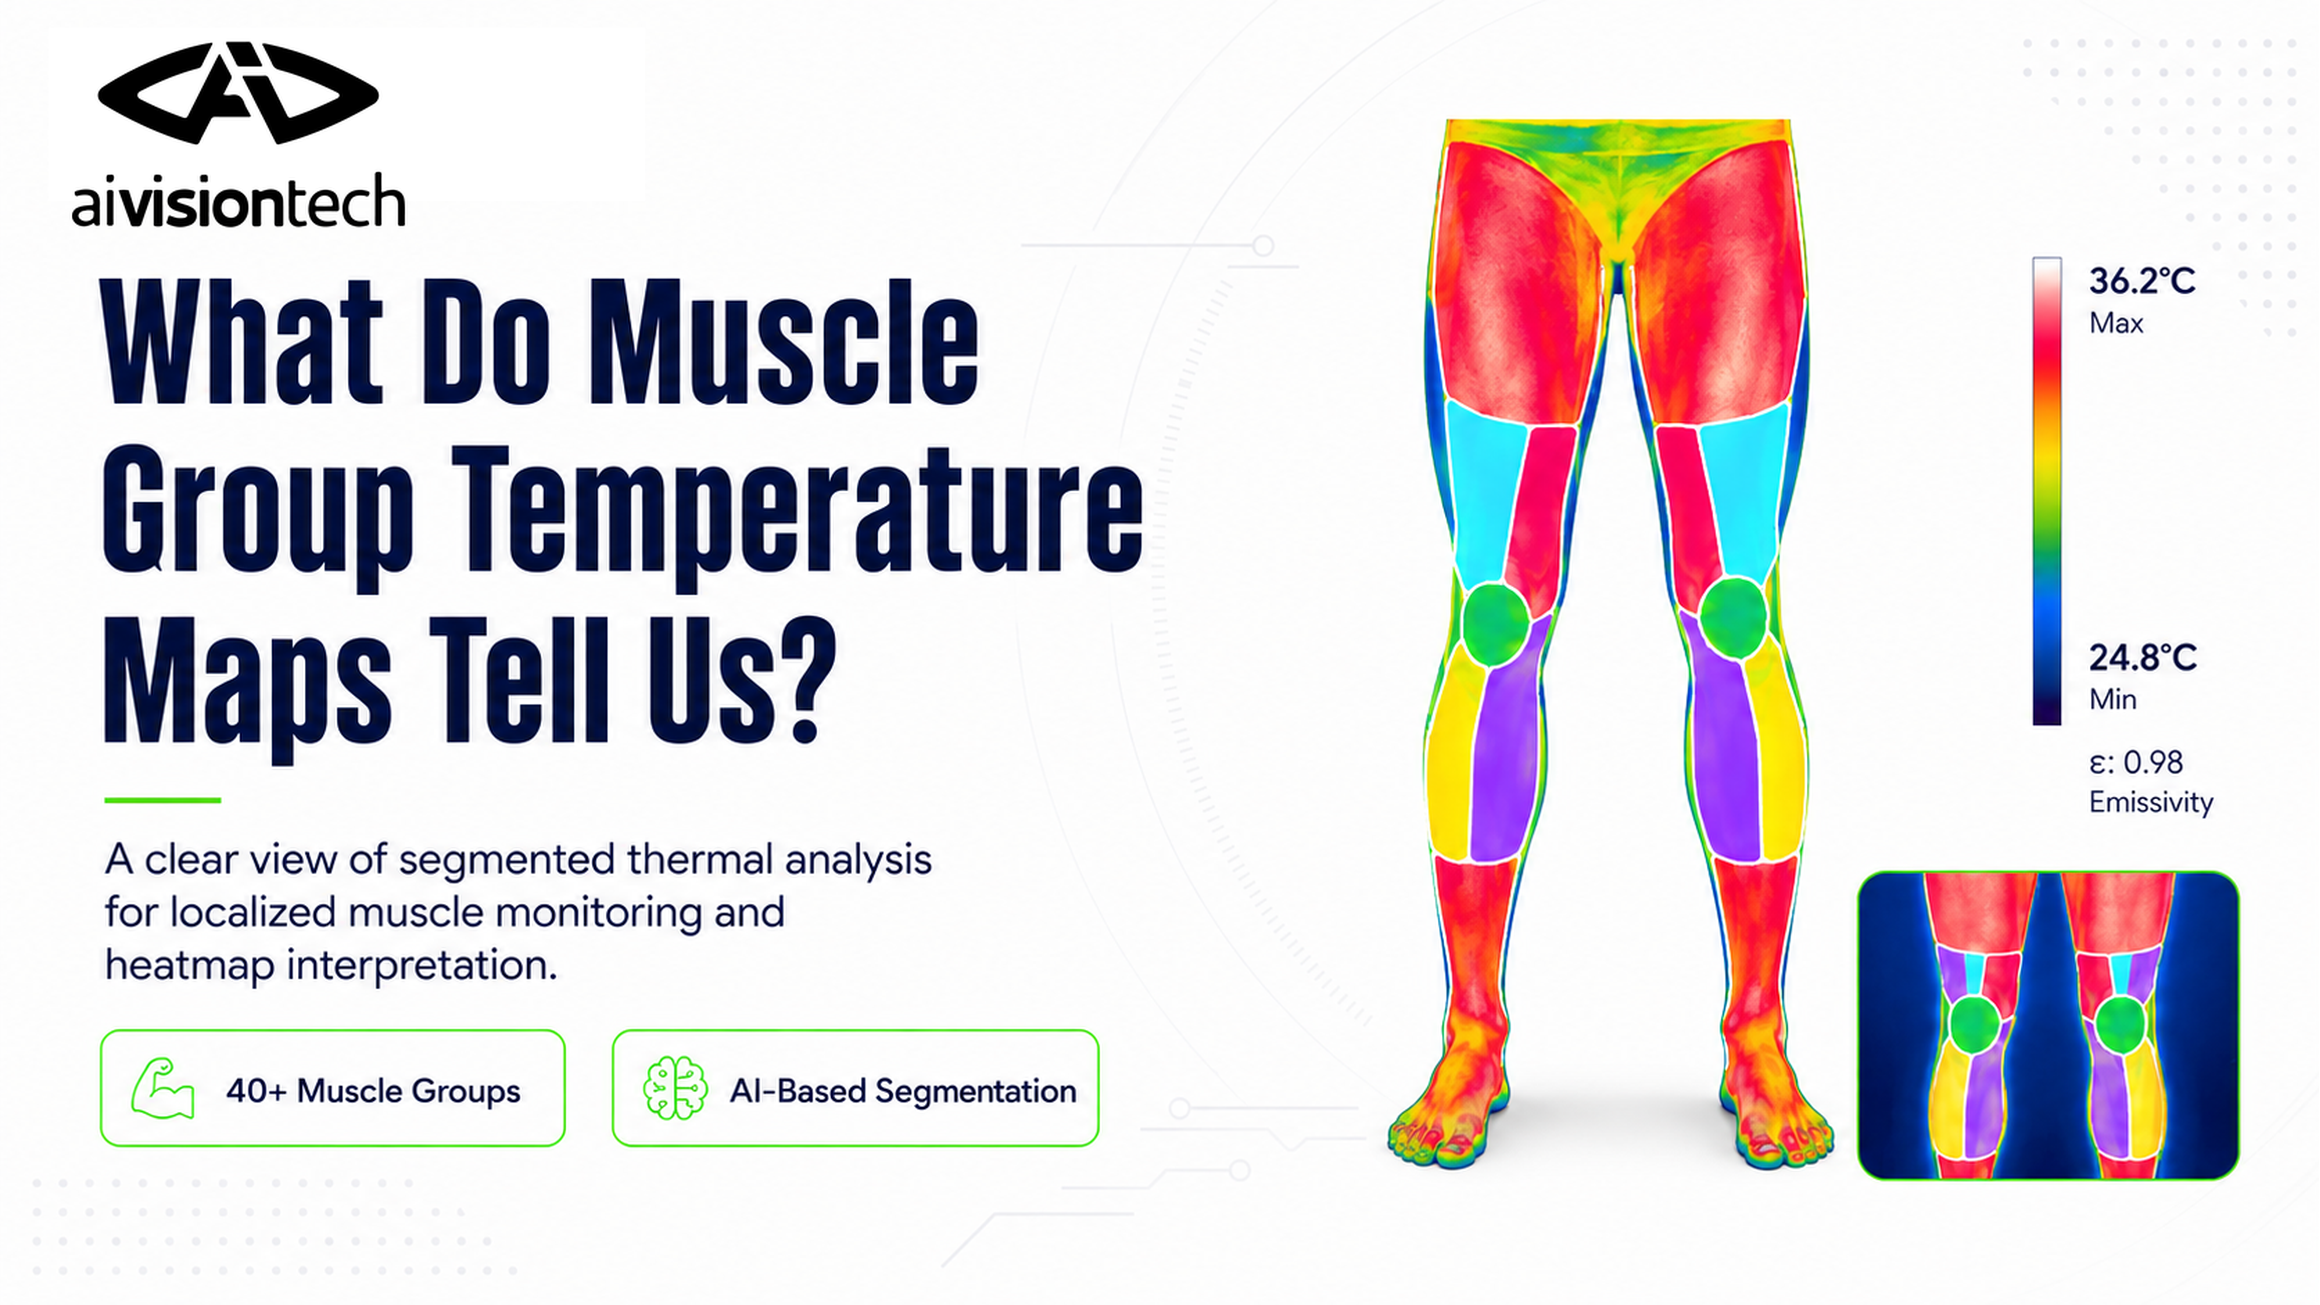
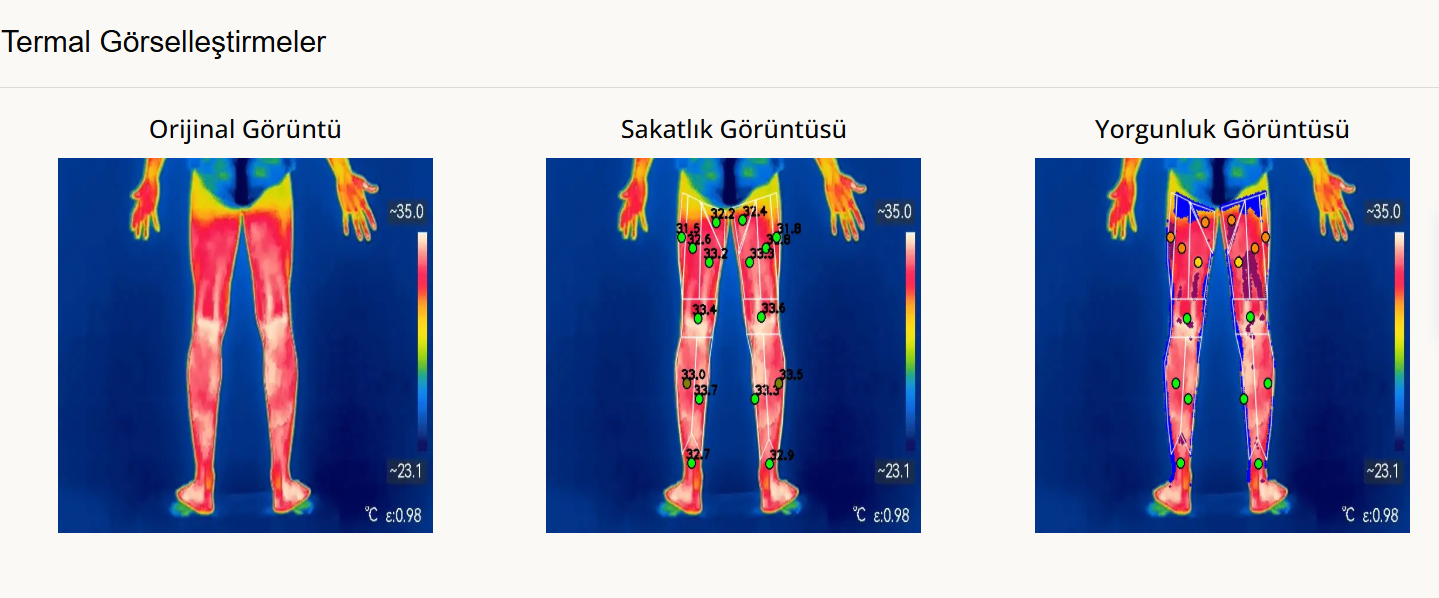
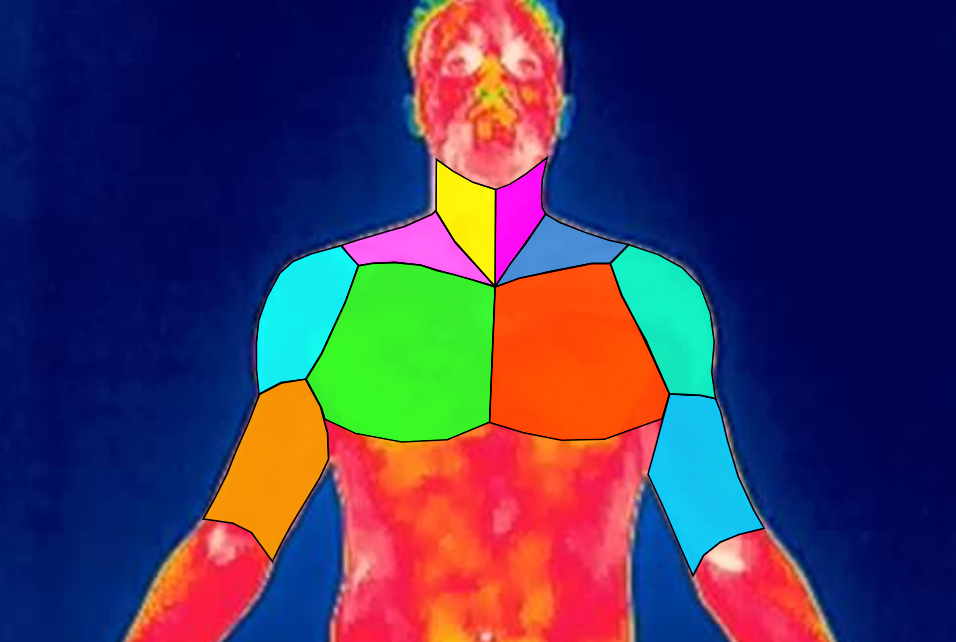
In the medical field, many advanced artificial intelligence models have demonstrated that strong segmentation results can be achieved even with limited datasets [1]. Using advanced AI-based muscle segmentation models, ai4sports segments 40 different muscle groups from thermal images within seconds, enabling rapid, automated, and highly accurate temperature-map generation [2-4].
The image below shows an example of how ai4sports can segment muscles from a raw thermal image and generate temperature maps for each muscle within seconds.
Reading the Color Scale Correctly
A thermal camera collects infrared energy from the area being imaged and converts it into temperature values. This temperature matrix is then converted into the RGB color space according to the selected color palette and presented to the user. To interpret the resulting thermal image correctly, the user needs to know:
- The selected color scale
- The minimum and maximum temperature range
- The emissivity value of the object being imaged
Thermal cameras convert infrared energy into a temperature value for each pixel based on parameters such as emissivity, distance, and humidity. These temperature values are ordered between the minimum and maximum values, and color codes from the selected palette are assigned to each image pixel according to its position within this range. This produces an interpretable and visually understandable thermal image.
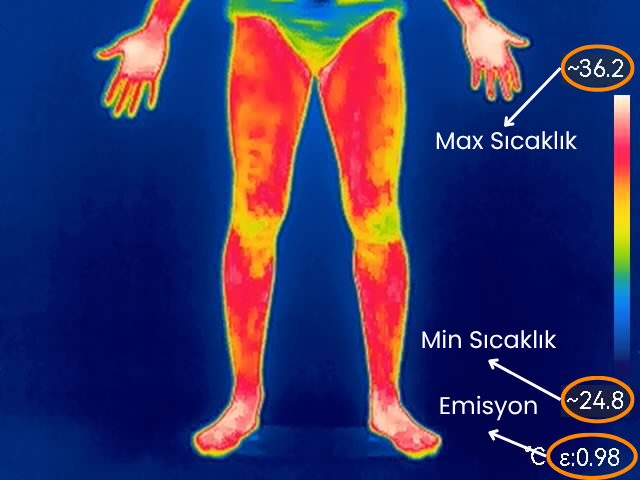
Important Note: Human skin has an emissivity value of 0.98. In software used for thermal analysis on humans, the thermal camera's emissivity setting should therefore be set to 0.98 [5].
Which Muscle Groups Can Be Analyzed?
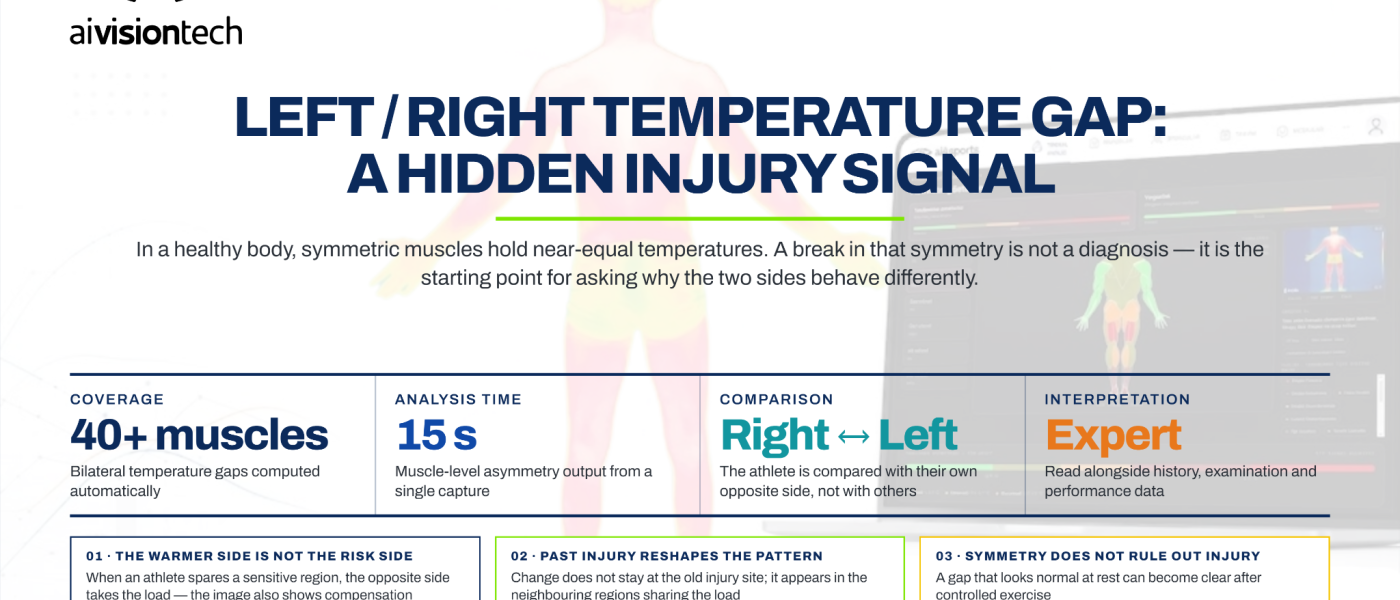
When body temperature is discussed, a range of approximately 36.5-37.2°C is commonly given. In a healthy person, this represents average internal (core) body temperature. Thermal cameras do not measure core temperature; they measure infrared energy emitted from the skin. Heat produced by metabolic processes is transported to the skin through blood circulation and tissue conduction. A thermal image therefore shows the distribution of temperature across the skin surface. Temperature asymmetries between symmetrical muscle groups may occur in association with underlying factors such as inflammatory processes, local physiological injuries, and blood perfusion.
In thermal images, human skin temperature is generally observed within a range of 32-35°C. Areas such as the eyeball and inner ear are closer to the body's core and may therefore show values that are closer to core temperature in thermal imaging.
The 40+ muscle groups analyzed by ai4sports were defined according to these principles and human anatomy, and the AI models were trained accordingly. With ai4sports, each thermal image is segmented according to the anatomy of the person being imaged, and the relevant muscle groups are extracted.
An important point is that thermal cameras measure surface temperature. Therefore, the analyzable areas are superficial muscle groups. Deep tissues and muscles, ligaments that are not close to the surface, and internal organs cannot be analyzed directly because their temperature values cannot be measured from the skin surface.
Muscle groups that can be analyzed with ai4sports include:
| Region | View | Muscle groups |
|---|---|---|
| Lower-Extremity Muscle Groups | Anterior | Foot, Ankle, Gastrocnemius and Soleus, Patellar Region, Rectus Femoris, Quadriceps Vastus, Tibialis Anterior, Upper Adductor, Vastus Medialis |
| Lower-Extremity Muscle Groups | Posterior | Achilles Tendon, Biceps Femoris / Lateral Hamstring, Calcaneal Region, Gastrocnemius Lateralis / Lateral Calf, Gastrocnemius Medialis / Medial Calf, Medial Hamstring, Popliteal Region, Adductor, Vastus Lateralis |
| Upper-Extremity Muscle Groups | Anterior | Abdominal Region, Biceps, Cervical Region, Deltoid, Extensor, Flexor, Hypochondriac Region, Carpal Region, Supraclavicular Region, Olecranon, Pectoral Region |
| Upper-Extremity Muscle Groups | Posterior | Cervical Region, Deltoid, Extensor, Flexor, Gluteal Region, Carpal Region, Lumbar Region (Paravertebral / Latissimus Dorsi), Olecranon, Rotator Cuff, Trapezius, Triceps |
For a more detailed overview of muscle-group analysis, visit the ai4sports product page.
Region-Based Interpretation: Patellar, Calf, Shoulder, and Other Areas
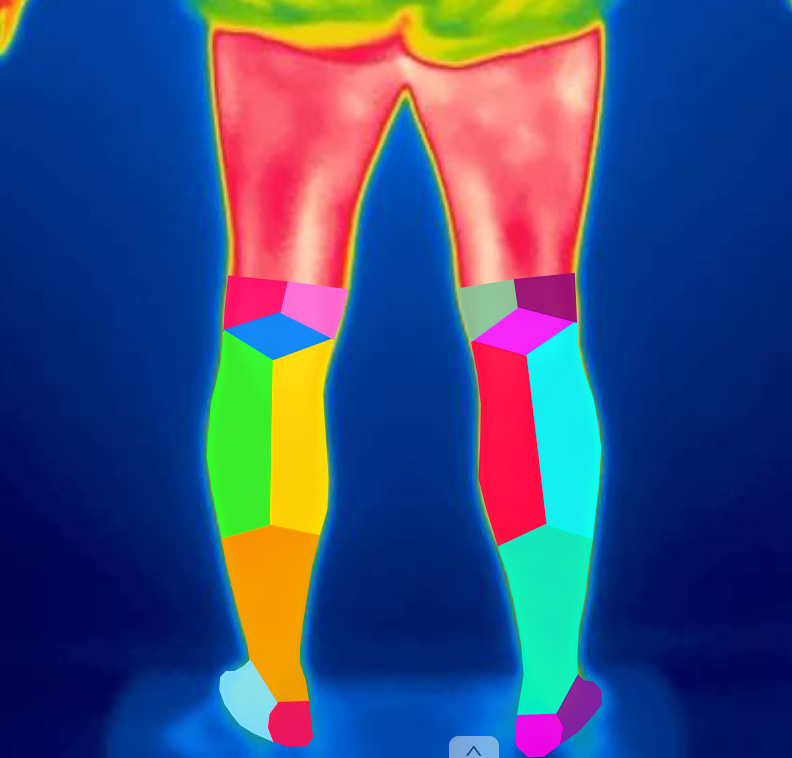
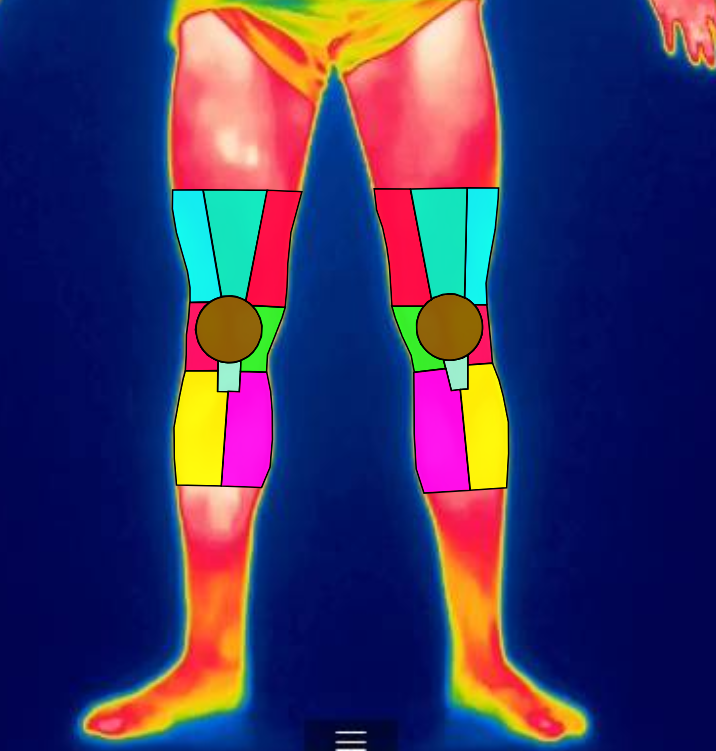
Thermal imaging can focus not only on overall body temperature distribution and general muscle groups but also on the independent assessment of specific anatomical regions. In particular, evaluating the right-left temperature difference (ΔT) in muscles, tendons, and joint regions that can be compared symmetrically may provide additional information about local physiological load. For this reason, regions such as the patellar area (knee), calf (gastrocnemius and soleus muscles), ankle, and hamstring can be monitored independently using thermal maps [6].
See how local region analyses can be performed on the ai4body product page.
The patellar tendon region is one area in which thermal changes associated with load distribution in the lower extremity can be monitored. In our studies, football players with a history of ankle injury showed changes in temperature asymmetry in the patellar tendon region after training [7].
Similarly, the calf is another region in which the thermal response to loading can be monitored. In the same study, temperature differences in the medial and lateral calf regions changed throughout the training process and could be evaluated together with lower-extremity loading [7].
In the hamstring region, thermal responses can also be examined together with the mechanical properties of the muscle. In our study, pre- and post-training thermal changes in the hamstring muscles were evaluated alongside myotonometric measurements, demonstrating that regional loading responses can be monitored using multiple parameters [8].
The rectus femoris region is another example of the use of thermal analysis in post-injury monitoring. In our study of elite football players, different thermal responses were observed between individuals despite exposure to the same training load, indicating the value of monitoring this region on an individual basis [9].
Local region analysis is used not only in the context of sports injury and fatigue analysis. Characterized thermal patterns associated with various diseases are also being investigated as potential decision-support information for healthcare professionals. Thermal analysis has therefore been studied in conditions ranging from breast cancer and diabetic foot to fibromyalgia and scleroderma.
Single Measurement or Trend? What Makes a Heat Map Meaningful
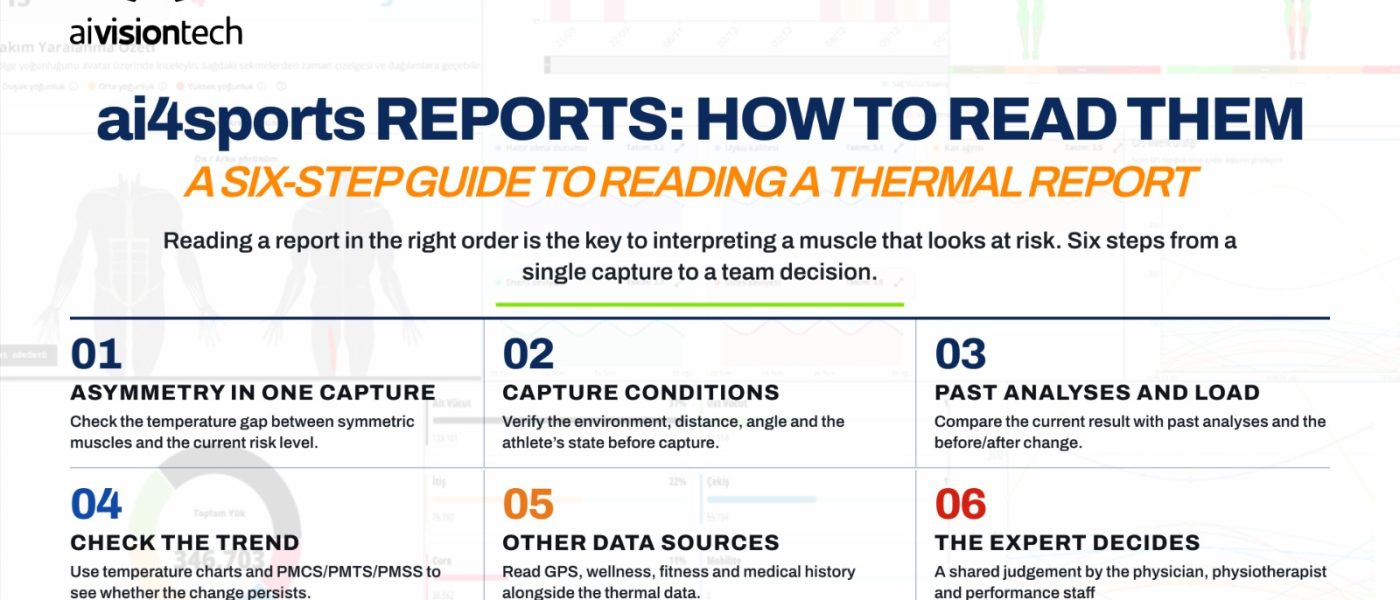
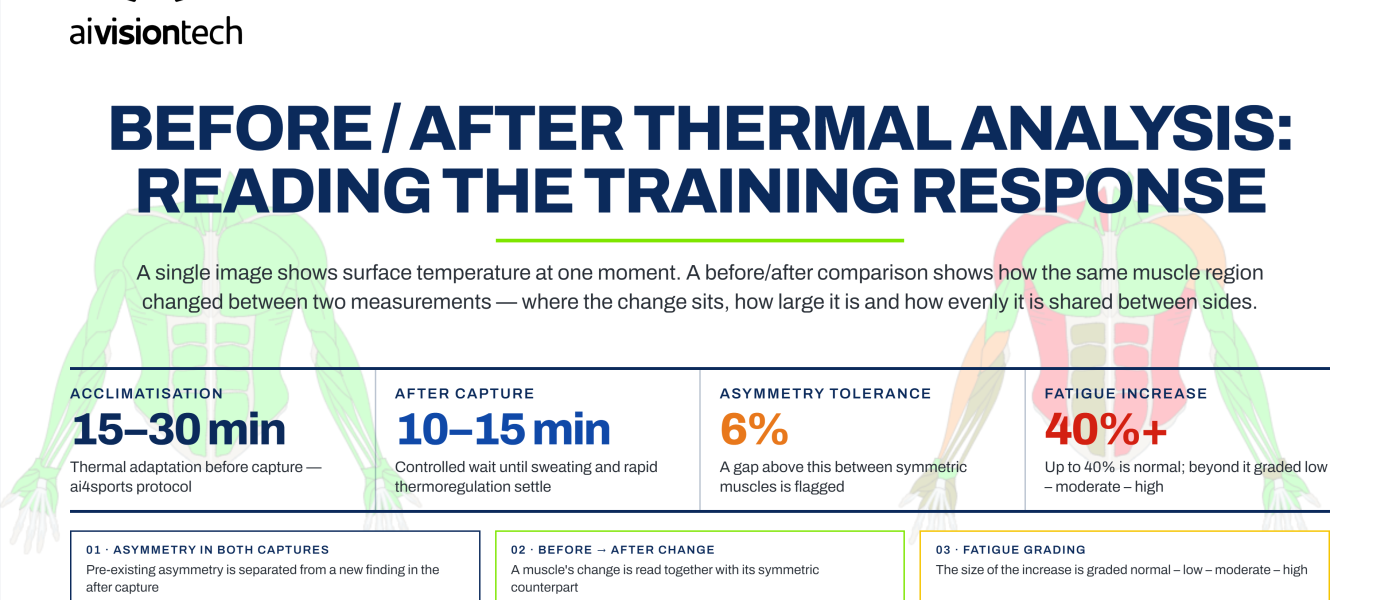
With ai4sports, thermal analyses of more than 40 individual muscle groups can be extracted from a single thermal capture, while repeated imaging also makes it possible to perform trend analyses for each muscle. A single thermal measurement shows the temperature distribution at a particular moment and allows an interpretation based on that snapshot. Periodic measurements, however, reveal the direction and persistence of change relative to the individual's own temperature trend line. This makes it possible to compare a temperature increase or asymmetry with previous measurements and determine whether it reflects a temporary response to load or an ongoing thermal trend. In ai4sports, this time-series approach enables more systematic monitoring of regional and overall changes through periodic scores such as PMCS, PMSS, and PMTS.
A Temperature Map Becomes Data When It Is Interpreted Correctly
On its own, a thermal image is a body heat map made up of colors. When evaluated with ai4sports using appropriate AI-based assessment, anatomical region segmentation, and comparison of symmetrical muscle groups, it becomes measurable data for each muscle group. Each superficial muscle group can be analyzed independently, and changes in these regions over time can also be compared with the individual's own thermal history. The central purpose of muscle-group-based thermal analysis is therefore not merely to see temperature in an image, but to understand where it changes, by how much, and in what way.
References
- Ronneberger, O., Fischer, P., Brox, T. (2015). U-Net: Convolutional Networks for Biomedical Image Segmentation. MICCAI 2015. Lecture Notes in Computer Science, vol 9351. Springer, Cham. https://doi.org/10.1007/978-3-319-24574-4_28
- Ergene, M.C., Bayrak, A., Çevik, M., Ceylan, M. (2023). Evaluation of Deep Learning Models for Lower Extremity Muscle Segmentation in Thermal Imaging. AIIIMA 2023. vol 14298. Springer, Cham. https://doi.org/10.1007/978-3-031-44511-8_9
- Çevik, M., Ceylan, M. (2023). Performance Evaluation of Convolutional Segmentation Models with Human Hand Thermal Images (H2TI) Dataset. In: Kakileti, S.T., Manjunath, G., Schwartz, R.G., Frangi, A.F. (eds) AIIIMA 2023. Lecture Notes in Computer Science, vol 14298. Springer, Cham. https://doi.org/10.1007/978-3-031-44511-8_6
- Yaşar, M.C., Çevik, M., Besnili, Ş., Ceylan, M. (2025). Comparison of Architectures of Deep Learning-Based Segmentation in Lower Extremity Human Thermal Imaging. In: Kakileti, S.T., Manjunath, G., Schwartz, R.G., Ng, E.Y.K. (eds) AIIIMA 2024. Lecture Notes in Computer Science, vol 15279. Springer, Cham. https://doi.org/10.1007/978-3-031-76584-1_10
- Lahiri BB, Bagavathiappan S, Jayakumar T, Philip J. Medical applications of infrared thermography: A review. Infrared Phys Technol. 2012 Jul;55(4):221-235. doi: 10.1016/j.infrared.2012.03.007. Epub 2012 Apr 13. PMID: 32288544; PMCID: PMC7110787.
- Besnili, Ş., Dinkul, İ., Bayrak, A., Çevik, M., Ceylan, M. (2025). The Effects of Balance and Strength on Thermal Heatmap. AIIIMA 2024. Lecture Notes in Computer Science, vol 15279. Springer, Cham. https://doi.org/10.1007/978-3-031-76584-1_9
- Bayrak, A., Çevik, M., & Ceylan, M. (2025). Thermal Asymmetry in Football Players Following Ankle Injury: Findings Related to Training Load.
- Bayrak, A., Çevik, M., & Ceylan, M. (2025). Relationship Between Myotonometric and Thermal Responses of Hamstring Muscles Before and After Training.
- Bayrak, A., Ergene, M. C., & Ceylan, M. (2023). Monitoring the Reactions of Athletes with History of Rectus Femoris Proximal Tear to Training Load.