



What Do Min, Max, and Mean Temperature Tell Us?
Each muscle region in a thermal image is made up of thousands of pixels. Different temperature parameters can be calculated from these pixels for each muscle region.
The Glamorgan Protocol provides a framework for recording and evaluating human thermal images in a standardized manner by consistently defining anatomical regions of interest (ROIs) and reporting regional temperature measurements [1]. Current thermography literature also emphasizes that regional temperature values should be assessed under standardized acquisition and analysis conditions [4].
Mean temperature is the average of all temperature pixels representing a muscle region and answers the question, “At what temperature level is this muscle group overall?” Maximum temperature indicates the pixel or local cluster with the highest temperature in the region. Minimum temperature indicates the lowest temperature value or local low-temperature cluster in the same region.
In short, the mean describes the general behavior of the region, while min and max show the two ends of the distribution and provide complementary perspectives.
For a more detailed explanation of how thermal images are segmented into muscle regions and how 40+ muscle groups are analyzed, see What Do Muscle-Group Temperature Maps Tell Us?.
Why Should We Read These Values Together?
A normal-looking mean temperature difference in a muscle region does not mean that every pixel in that region behaves the same way. For example, most of a large quadriceps region may have similar temperatures while a small point shows a marked temperature increase. That small area may change the mean only slightly and still appear acceptable, while it becomes more visible in the maximum value.
Formenti and colleagues examined this distinction by monitoring the quadriceps region of 13 active male participants during squat exercise [2]. Thermal recording started 120 seconds before exercise and continued for 480 seconds after exercise began. For the same muscle region, both the ROI mean temperature and a Tmax approach representing the hottest area were calculated. Both methods generally followed exercise-induced temperature changes in the same direction, but the difference between the measurements increased during exercise. This shows that mean temperature and local hot spots can extract different information from the same image [2].
Verderber and colleagues reanalyzed thermal data from 69 participants across four separate studies in 2024 [3]. The dataset included half-marathon and marathon runners as well as individuals who participated in quadriceps and triceps surae muscle-damage protocols. The researchers compared mean, minimum, maximum, standard deviation, Tmax, entropy, and pixelgraphy metrics. Tmax and maximum temperature showed a very strong relationship, while the relationship between mean temperature and Tmax was lower [3].
Overall, mean temperature is often used as a global comparison parameter, but metrics such as min and max should not be ignored. Evaluating all three together provides a more complete view of regional thermal change.
Effect of Environment and Measurement Conditions
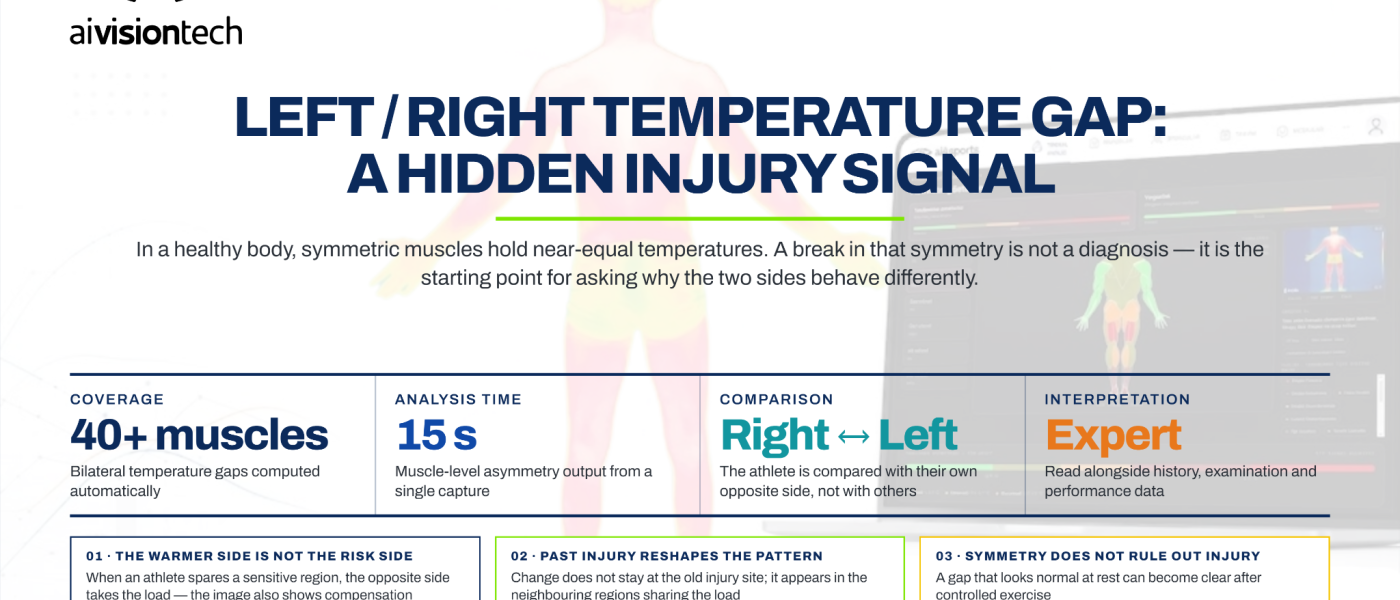
Temperature values measured with a thermal camera do not depend only on the athlete’s physiological state. Room temperature, humidity, airflow, recent exercise, sweating, and adaptation time to the recording environment can also affect thermal imaging. Camera distance, viewing angle, and athlete positioning can create differences between measurements.
Standardization is therefore one of the most important elements of thermography. The Glamorgan Protocol provided an early framework [1], while the TISEM consensus, developed by 24 experts from 13 countries, introduced a 15-item standardization framework covering camera and room conditions, participant preparation, and image analysis [4]. More recent systematic reviews also show that post-exercise skin temperature may vary depending on recording time and protocol [5],[6].
Because min and max directly reflect local pixel-level changes, standardized acquisition conditions become even more important. This does not make min or max less valuable. Rather, standardized protocols indicate that distance, angle, environment, and recording timing should be kept consistent when comparing periodic measurements from the same athlete.
For more detail on room, camera, and athlete preparation, see What Is Thermal Imaging and How Is It Used in Sports?.
How Is a Periodic Temperature Trend Created?
A single analysis shows the athlete’s current mean, min, and max values. Over a season, however, seeing how the same muscle group changes across periodic analyses is more valuable for supporting athlete availability and risk management.
With regular standardized recordings in ai4sports, temperature values for relevant muscle regions begin to accumulate. Over time, the athlete’s normal temperature trend is formed. Later analyses can then be compared with previous measurements of the same muscle group. ai4sports also supports periodic analysis with scores such as PMCS, PMSS, and PMTS so changes over time can be followed together. For more detail, see the “Single Measurement or Trend?” section of What Do Muscle-Group Temperature Maps Tell Us?.
What Should We Do When an Abnormal Value Appears?
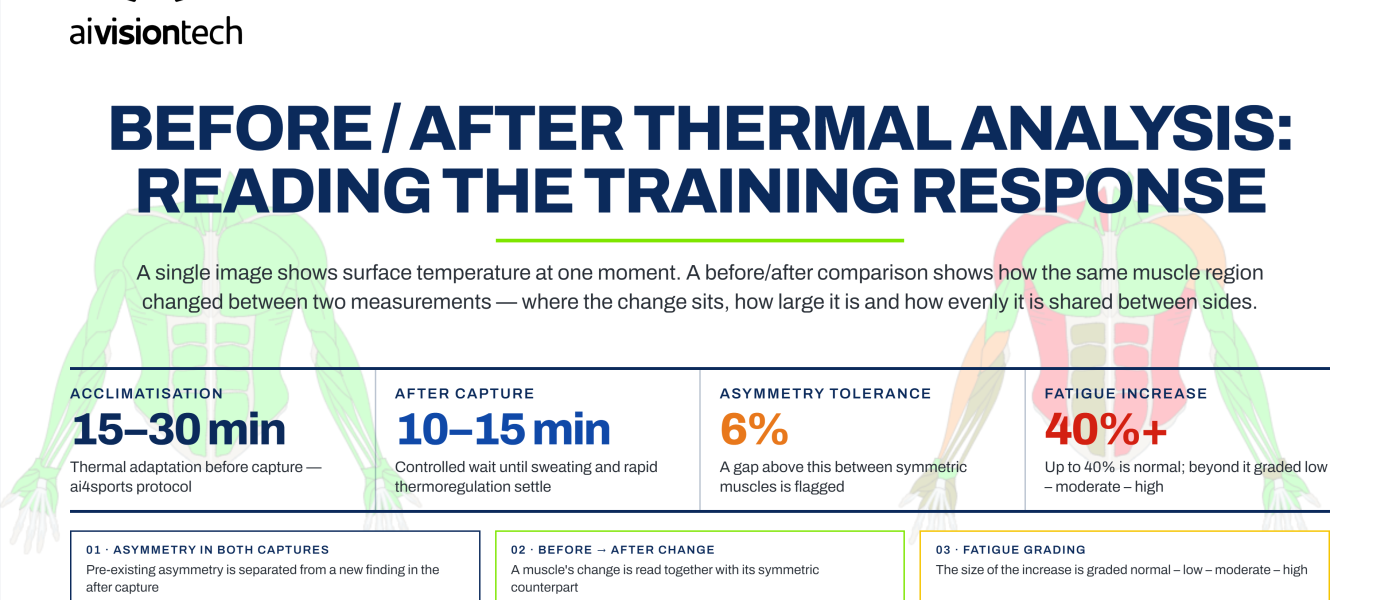
A higher- or lower-than-expected temperature value in a muscle group does not, by itself, mean injury risk. First, acquisition conditions should be checked and the measurement repeated if necessary.
The thermal measurement that triggered concern should then be compared with the athlete’s previous analyses. In this comparison, the direction of the trend and whether the change persists are important. If changes in mean, min, or max temperature are accompanied by pain, performance loss, or other clinical findings, evaluation by the medical team is required.
In short:
Validate the measurement → compare with previous analyses → check the trend → refer to the medical team when appropriate.
Thermal analysis is not a diagnostic tool. It provides an objective and traceable risk signal for medical and athletic-performance teams.
For why thermal findings differ from structural imaging such as MRI, ultrasound, or X-ray, see Thermography vs Conventional Imaging.
How Are These Values Visualized in the Dashboard?
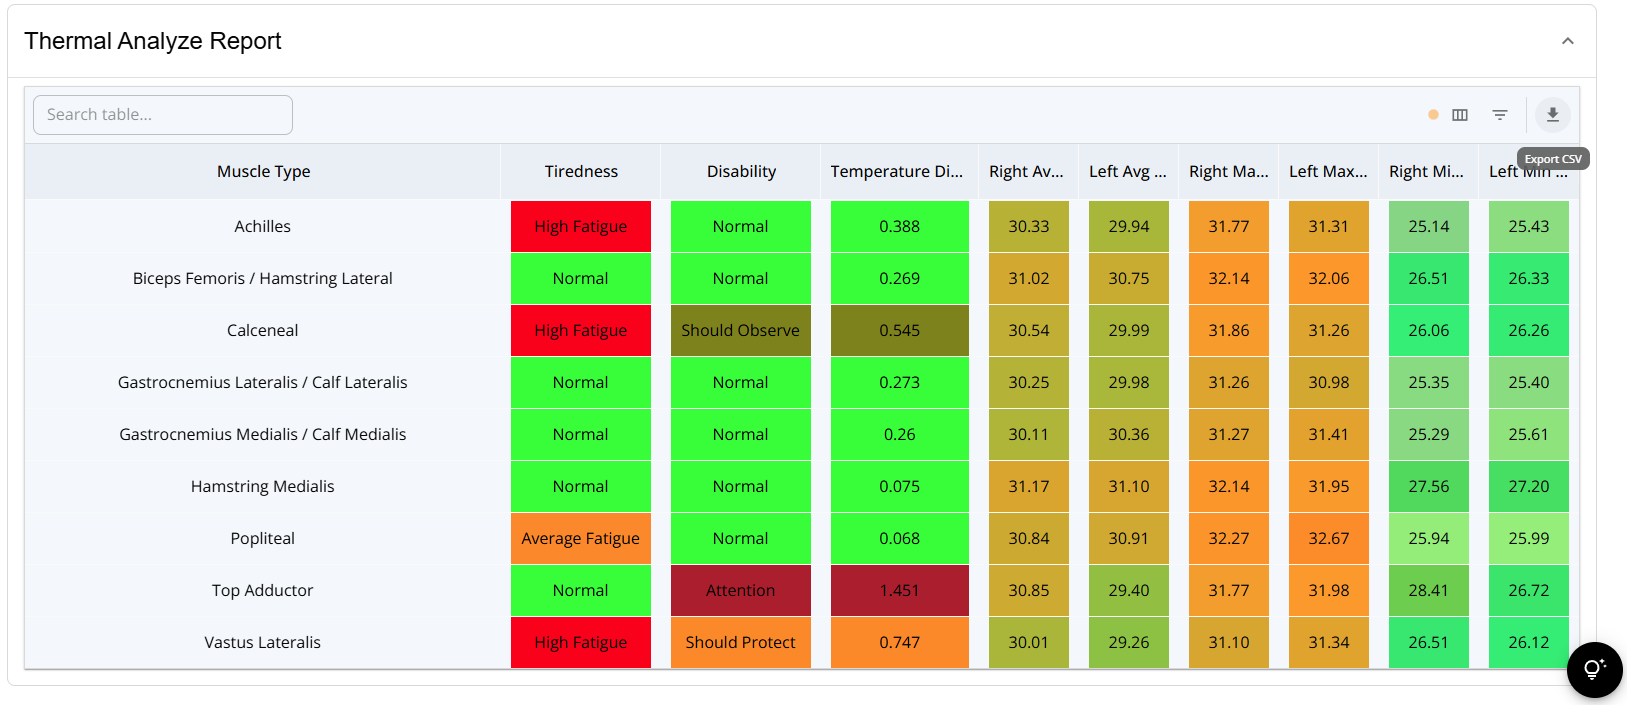
In ai4sports, the minimum, maximum, and mean temperature values of each analyzed muscle region can be viewed in the same table. This allows the reviewer to evaluate the three core numerical values of the same region together.
Thermal data can also be exported in CSV format. This matters not only for reporting but also for academic research. Researchers can compare min, max, and mean values from different muscle groups using their own methods and can analyze temperature data alongside strength, balance, or other performance variables.
An example is discussed in How Do Balance and Strength Affect the Thermal Heat Map?, where thermal data from 11 basketball players were evaluated together with dynamic balance and knee-strength measurements.
From this perspective, ai4sports is not only a dashboard that displays results; it is a data infrastructure that makes structured thermal data available for independent statistical analysis.
One Temperature Value Does Not Tell the Whole Story
Choosing one of mean, min, or max as “the correct value” oversimplifies thermal analysis. Mean temperature summarizes the overall thermal behavior of a muscle group, while min and max show what happens at the edges of the distribution.
For coaches, the main value comes not from viewing these values once, but from tracking how they change across periodic analyses of the same athlete. The mean may remain stable while max changes, or min may move in another direction. These changes become more meaningful when interpreted together with the temperature map of the same muscle group and previous analyses.
The goal of thermal analysis is not to make decisions from one number, but to understand how regional temperature is distributed and how it changes over time.
References
- Ammer, K. (2008). The Glamorgan Protocol for recording and evaluation of thermal images of the human body. Thermology International, 18(4), 125–144.
- Formenti, D., Ludwig, N., Rossi, A., Trecroci, A., Alberti, G., Gargano, M., Merla, A., Ammer, K., & Caumo, A. (2017). Skin temperature evaluation by infrared thermography: Comparison of two image analysis methods during the nonsteady state induced by physical exercise. Infrared Physics & Technology, 81, 32–40. https://doi.org/10.1016/j.infrared.2016.12.009
- Verderber, L., da Silva, W., Aparicio-Aparicio, I., Germano, A. M. C., Carpes, F. P., & Priego-Quesada, J. I. (2024). Assessment of alternative metrics in the application of infrared thermography to detect muscle damage in sports. Physiological Measurement, 45(9), 095014. https://doi.org/10.1088/1361-6579/ad7ad3
- Moreira, D. G., Costello, J. T., Brito, C. J., Adamczyk, J. G., Ammer, K., Bach, A. J. E., et al. (2017). Thermographic imaging in sports and exercise medicine: A Delphi study and consensus statement on the measurement of human skin temperature. Journal of Thermal Biology, 69, 155–162. https://doi.org/10.1016/j.jtherbio.2017.07.016
- Neves, E. B., et al. (2021). Short-Term Skin Temperature Responses to Endurance Exercise: A Systematic Review of Methods and Future Challenges in the Use of Infrared Thermography. Life, 11(12), 1286. https://doi.org/10.3390/life11121286
- Masur, L., Brand, F., & Düking, P. (2024). Response of infrared thermography related parameters to (non-)sport specific exercise and relationship with internal load parameters in individual and team sport athletes—a systematic review. Frontiers in Sports and Active Living, 6, 1479608. https://doi.org/10.3389/fspor.2024.1479608