


What Is Thermal Asymmetry? Thermoregulation in the Human Body
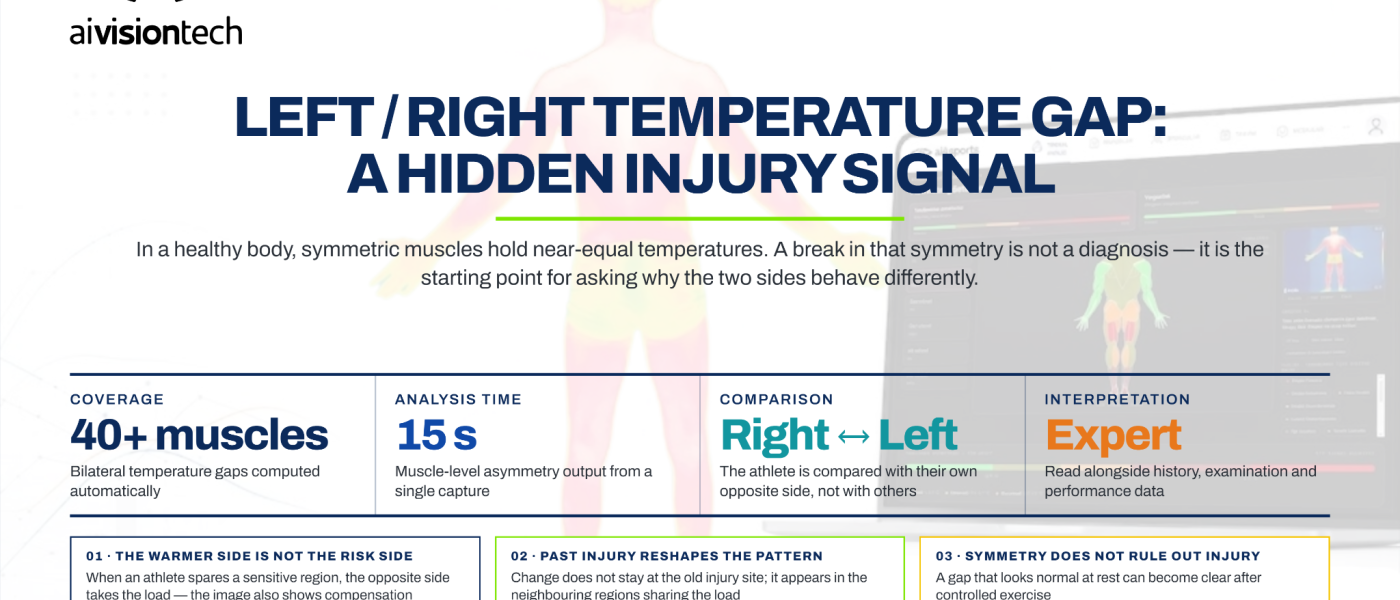
Although the human body is not anatomically perfectly symmetrical, corresponding regions on the right and left sides are influenced by similar circulatory and thermoregulatory mechanisms. Under healthy conditions, skin-surface temperatures of corresponding anatomical regions are therefore expected to remain relatively close. In thermography, thermal asymmetry refers to the difference in temperature between the right and left sides of the same anatomical region.
This approach has been investigated since the early studies of thermography. Uematsu and colleagues examined temperature differences in symmetrical regions of healthy individuals and established normative data for normal bilateral differences [2]. A study by Niu and colleagues involving younger and older individuals in Taiwan also observed a clear tendency toward right-left thermal symmetry across body regions in healthy participants [3].
When evaluating thermal symmetry, it is not appropriate to expect an absolute 0°C difference between the right and left sides. Sport type, limb dominance, individual anatomy, previous injuries, recent training and measurement conditions may all introduce variation. Thermal asymmetry should therefore be interpreted not only by the magnitude of the difference, but also together with these internal and external factors and the individual’s own historical values.
Thermal analysis of symmetrical anatomical regions also has certain limitations. Analyses based on manually drawn muscle regions may be considered subjective because differences in drawing technique and technical expertise make standardization difficult. Our AI segmentation models developed to separate thermal images into muscle regions provide a basis for automatically comparing anatomically corresponding muscle groups bilaterally and for generating more objective data [4],[5].
For a more detailed explanation of how a thermal camera captures temperature values and how these maps are separated into muscle regions, see our article What Do Muscle Group-Based Temperature Maps Tell Us?.
Thermal Asymmetry and Injury Risk: What Do the Thresholds Mean?
Each individual has a unique thermal profile. For this reason, the most appropriate way to evaluate a person is against their own thermal map and historical measurements. In thermal assessment, the absolute temperature of the right and left regions is less important than how much the temperature difference increases and how far that change departs from the athlete’s normal thermal profile.
In a prospective study of professional football players, Côrte and colleagues used a graded thermal monitoring protocol. Differences up to 0.3°C were considered normal; 0.3–0.4°C indicated a change that should be monitored; 0.5–1.0°C was a level at which preventive intervention could be considered; 1.0–1.5°C was associated with higher-risk asymmetry; and values above 1.5°C were treated as more substantial asymmetry [1].
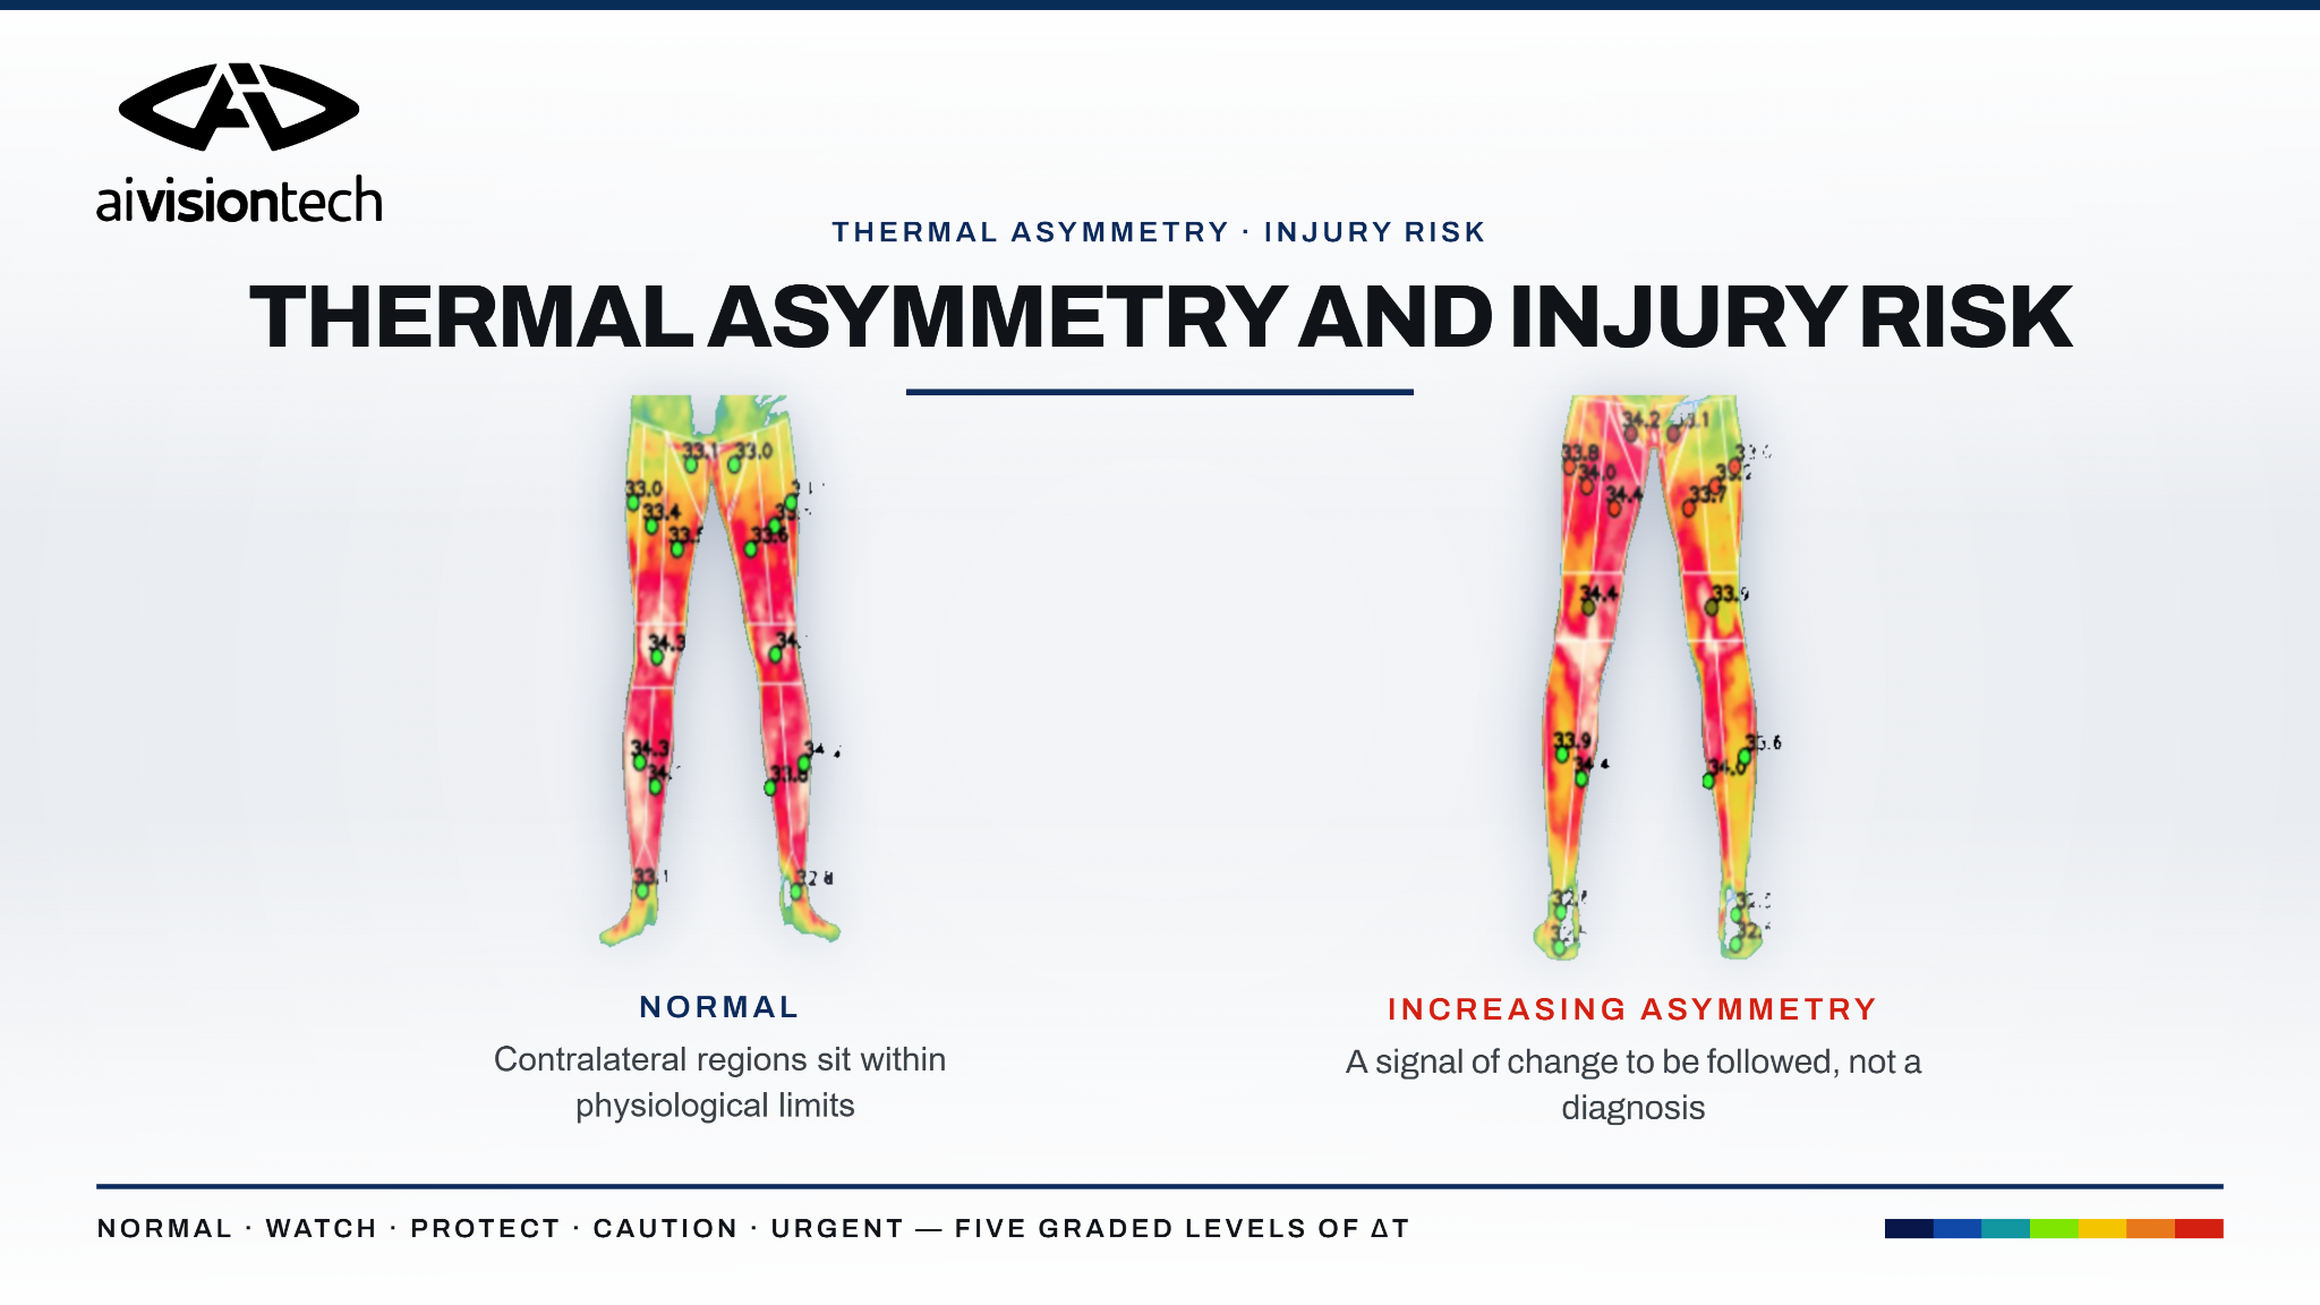
In ai4sports, thermal asymmetry is classified into five risk levels according to the magnitude of the temperature difference: Normal, Should Observe, Should Protect, Attention and Urgent. This grading is not intended to diagnose an injury. It is used to standardize the magnitude of the measured thermal change, follow the trend, and provide structured decision-support data to the medical team when necessary.
| Asymmetry Level | Temperature Difference (ΔT) | ai4sports Risk Label | Interpretation |
|---|---|---|---|
| Low asymmetry | ≤ 0.4°C | Normal | Difference generally considered within physiological limits. |
| Mild asymmetry | 0.4–0.7°C | Should Observe | A level recommended for repeat measurement and trend monitoring. |
| Increasing asymmetry | 0.7–1.0°C | Should Protect | Requires closer monitoring in relation to loading and recovery. |
| Marked asymmetry | 1.0–1.5°C | Attention | A more pronounced thermal change that should be evaluated with clinical and performance data. |
| High asymmetry | > 1.5°C | Urgent | Advanced thermal difference that may warrant specialist evaluation. |
Our asymmetry assessments have been examined in different contexts. In a study by Bayrak et al. involving U19 football players, post-training thermal asymmetry in athletes with a history of ankle injury was shown to change across later follow-ups from the ankle and knee regions toward the medial and lateral calf regions [6].
Similarly, Ergene et al. compared the responses of two elite football players with a history of rectus femoris injury to the same training load and reported clearly different bilateral thermal changes [7]. The athlete who showed the greater thermal change subsequently sustained another injury in the same region, highlighting the importance of monitoring both the individual baseline and the thermal response to loading.
In one of our earlier studies, problematic muscle regions in professional football players were monitored thermally before and after rest, showing that regional temperature differences can change over time during the post-injury period [8]. Taken together, these studies indicate that thermal asymmetry is not a single fixed value, but a dynamic parameter that may change with injury history, loading and recovery.
For this reason, the 0.4 / 0.7–1 / 1–1.5 / 1.5°C+ ranges should not be interpreted as absolute injury boundaries. They are monitoring levels that grade thermal data in relation to risk.
In Which Regions Is Asymmetry More Common?
Thermal asymmetry should not be interpreted in exactly the same way in every body region. Sport discipline, limb dominance, movement patterns and the anatomical characteristics of a region may influence normal thermal distribution. A right-left difference in the lower extremities of a football player should therefore not be interpreted in the same context as a bilateral difference in an athlete whose upper extremities are used intensively.
In football, lower-extremity regions exposed to high mechanical loads—particularly the thigh, knee, hip, groin, calf and ankle—are important for regular monitoring. In a peer-reviewed study of professional football players, a protocol combining regular thermography-based monitoring with personalized interventions by the medical team was associated with fewer injuries and fewer injury-related days lost [9].
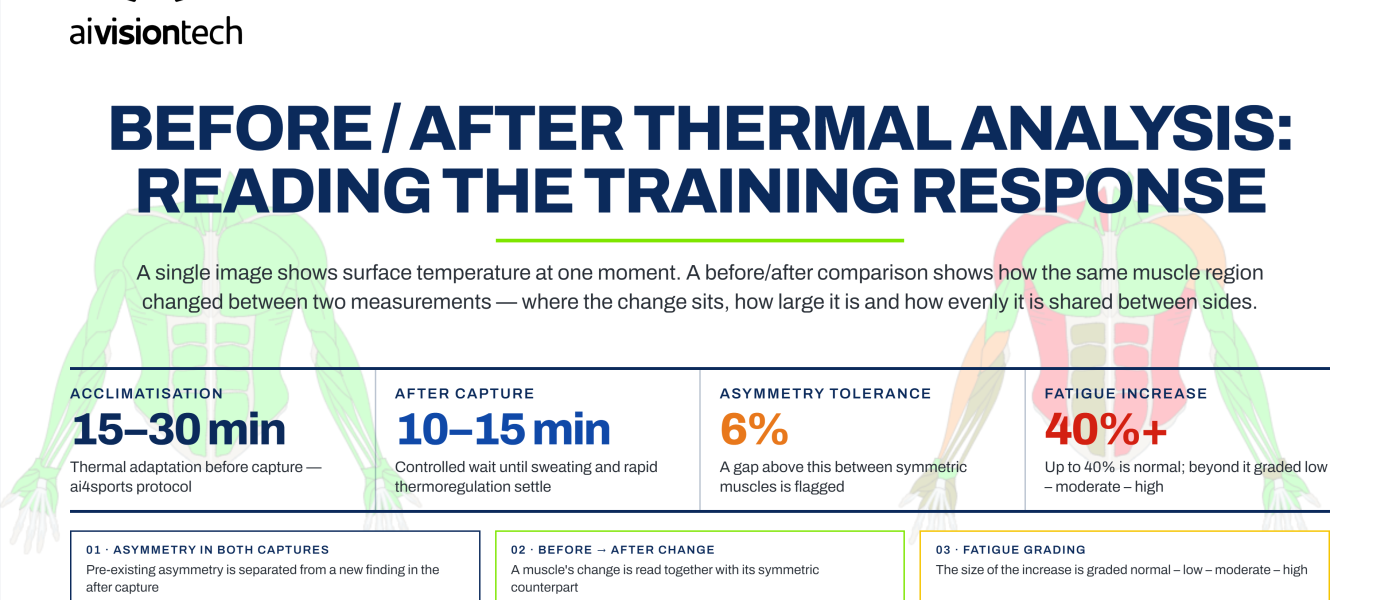
Our studies examining return to sport after rectus femoris injury likewise show that the same training load may produce different thermal responses in different individuals [7]. In a case study involving the sartorius region, a local thermal change that was not evident at rest became visible after controlled exercise [10]. These examples show that which region is assessed, at what time point, and under what loading condition is important when interpreting thermal asymmetry.
However, not every thermal asymmetry indicates injury. Independent studies in football players have also found no direct association between muscle-strength imbalances and skin-temperature asymmetries [11]. Thermal asymmetry should therefore not be interpreted on its own as a mechanical strength imbalance or as evidence of a specific pathology.
For more detail on region-based thermal interpretation, see our article What Do Muscle Group-Based Temperature Maps Tell Us?.
What to Do When an Asymmetry Signal Appears and How Data Can Help Reduce Risk
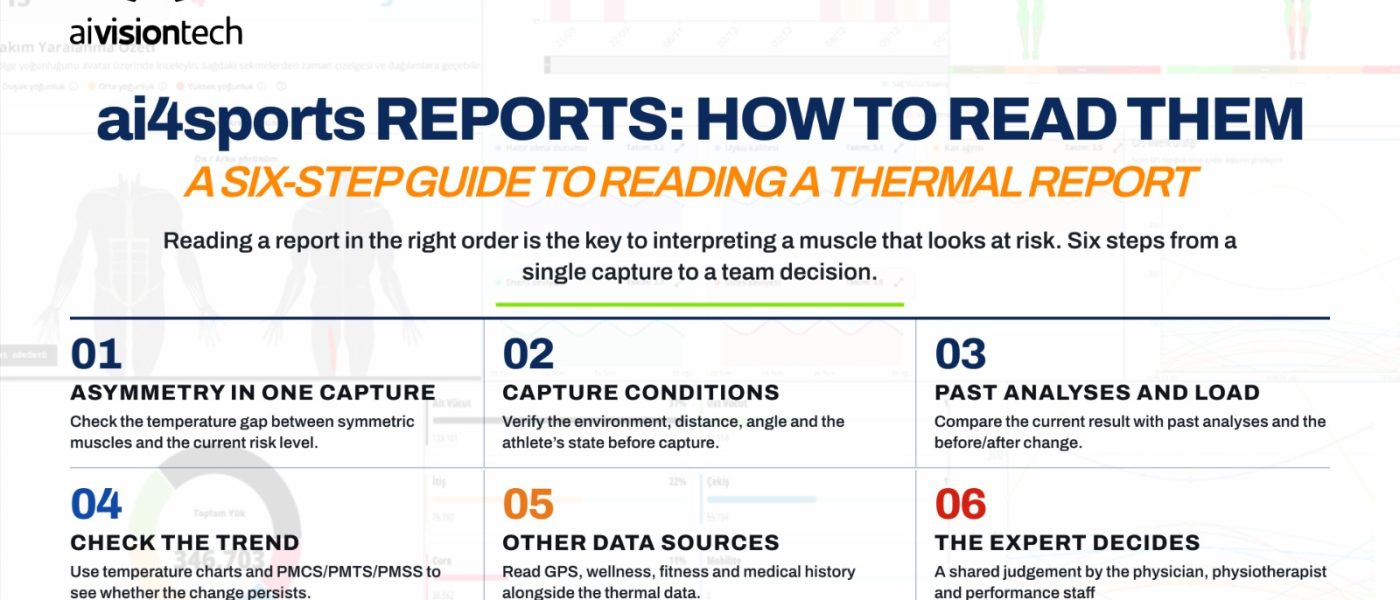
Thermal asymmetry above a defined monitoring threshold does not automatically mean that an athlete should be withheld from training. Measurement conditions should first be checked and, when needed, the measurement should be repeated. If the change persists, it should be compared with the athlete’s own historical values and loading history.
The data can be used in the following sequence:
Compare with previous measurements → check the trend → assess load and symptoms → refer to the medical team when necessary
This approach is illustrated by different monitoring scenarios. Evaluating professional football players before and after rest following injury showed that thermal values can be re-measured throughout the recovery process [8]. The fact that football players returning after rectus femoris injury responded differently to the same training load further demonstrates the importance of individualized assessment [7].
The value of thermography is therefore not limited to showing a temperature difference. Its value also lies in determining whether the measured change recurs and tracking its direction over time, thereby providing structured data to medical and performance teams.
ai4sports automatically analyzes right-left temperature differences across 40+ muscle and anatomical regions, compares them with previous measurements and can be used to follow temperature-change trends. Decisions on training-load adjustment, rehabilitation or further clinical evaluation remain the responsibility of the medical and performance team.
For a more detailed explanation of why thermography differs from structural imaging methods such as MRI, ultrasound and X-ray, see Thermography vs Conventional Imaging.
Asymmetry Is Not a Diagnosis; It Is a Signal of Change
Corresponding anatomical regions in a healthy human body generally show thermal symmetry. Disruption of this balance can occur due to training load, inflammatory processes, circulatory changes, previous injuries or other physiological factors. Thermal asymmetry should therefore be read not as an injury by itself, but as a signal of change whose cause should be investigated.
The thresholds used in the literature and the risk grades in ai4sports help standardize the monitoring of this change, but no temperature difference alone constitutes a definitive injury threshold. The most meaningful interpretation emerges when the characteristics of the anatomical region, the athlete’s own baseline, the right-left difference and the trend over time are considered together. This is where thermography contributes to injury-risk management: it makes deviation from normal visible rather than imaging the injury itself.
References
- Côrte, A. C., Pedrinelli, A., Marttos, A., Souza, I. F. G., Grava, J., & Hernandez, A. J. (2019). Infrared thermography study as a complementary method of screening and prevention of muscle injuries: Pilot study. BMJ Open Sport & Exercise Medicine, 5(1), e000431. https://doi.org/10.1136/bmjsem-2018-000431
- Uematsu, S., Edwin, D. H., Jankel, W. R., Kozikowski, J., & Trattner, M. (1988). Quantification of thermal asymmetry. Part 1: Normal values and reproducibility. Journal of Neurosurgery, 69(4), 552–555. https://doi.org/10.3171/jns.1988.69.4.0552
- Niu, H. H., Lui, P. W., Hu, J. S., Ting, C. K., Yin, Y. C., Lo, Y. L., Liu, L., & Lee, T. Y. (2001). Thermal symmetry of skin temperature: Normative data of normal subjects in Taiwan. Zhonghua Yi Xue Za Zhi (Taipei), 64(8), 459–468.
- Ergene, M. C., Bayrak, A., Çevik, M., & Ceylan, M. (2023). Evaluation of Deep Learning Models for Lower Extremity Muscle Segmentation in Thermal Imaging. In Artificial Intelligence over Infrared Images for Medical Applications (AIIIMA 2023), LNCS 14298. Springer. https://doi.org/10.1007/978-3-031-44511-8_9
- Yaşar, M. C., Çevik, M., Besnili, Ş., & Ceylan, M. (2025). Comparison of Architectures of Deep Learning-Based Segmentation in Lower Extremity Human Thermal Imaging. In Artificial Intelligence over Infrared Images for Medical Applications, LNCS 15279. Springer. https://doi.org/10.1007/978-3-031-76584-1_10
- Bayrak, A., Çevik, M., & Ceylan, M. (2026). Thermal asymmetry in football players following ankle injury: Findings related to training load. In Artificial Intelligence over Infrared Images for Medical Applications (AIIIMA 2025), LNCS 16308, 128–142. Springer. https://doi.org/10.1007/978-3-032-10990-3_9
- Bayrak, A., Ergene, M. C., & Ceylan, M. (2023). Monitoring the reactions of athletes with history of rectus femoris proximal tear healed with different methods to training load with thermography. Turkish Journal of Sport and Exercise, 25(2), 231–239.
- Ergene, M. C., Bayrak, A., & Ceylan, M. (2020). Tracking the injury recovery of professional football players with infrared thermography: Preliminary study. Avrupa Bilim ve Teknoloji Dergisi, 207–213. https://doi.org/10.31590/ejosat.804151
- Gómez-Carmona, P., Fernández-Cuevas, I., Sillero-Quintana, M., Arnaiz-Lastras, J., & Navandar, A. (2020). Infrared thermography protocol on reducing the incidence of soccer injuries. Journal of Sport Rehabilitation, 29(8), 1222–1227. https://doi.org/10.1123/jsr.2019-0056
- Bayrak, A., Ergene, M. C., & Ceylan, M. (2024). Thermography method under the influence of exercise in the detection of muscle injuries: Sartorius muscle case report. Journal of Bodywork and Movement Therapies, 39, 109–115. https://doi.org/10.1016/j.jbmt.2024.02.029
- Teixeira, R. M., et al. (2020). Muscular Strength Imbalances Are Not Associated with Skin Temperature Asymmetries in Soccer Players. Life, 10(7), 102. https://doi.org/10.3390/life10070102